Inventory : Reporting
Purpose
This document reviews all pre-configured Inventory Reports and their usage. To review the Odoo 15 Inventory report options and features, please review Odoo Essentials: Odoo Navigation Overview. The documentation on that page will help you tailor this, and all Odoo reports to your business needs.
Process
To get started, navigate to the Inventory app.
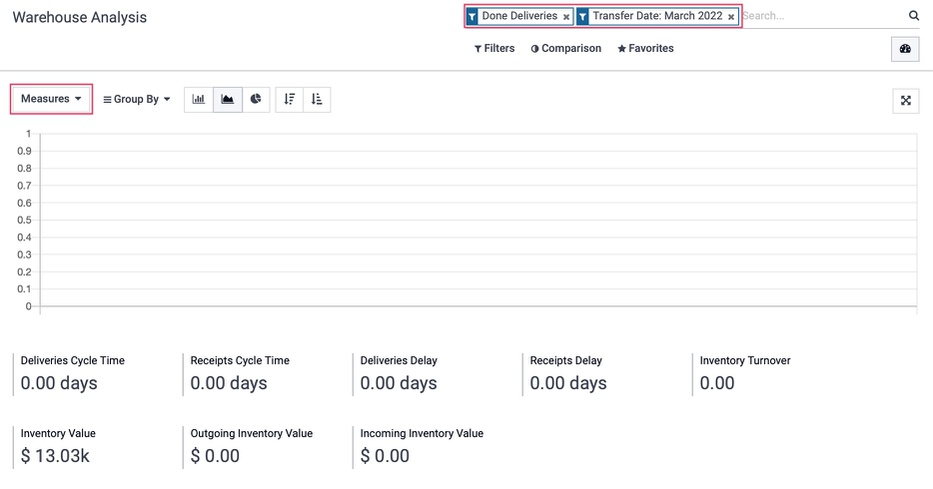
Warehouse Analysis
To access this report, click Reporting > Warehouse Analysis.
About This Report
This report gives an overall view of the efficiency of your warehouse by reporting process times and financial data.
The default analyzed data is for transfers done in the last 30 days broken down into three different visual reports. Use the Measures drop-down to display Delay or Product Quantity or Cycle Time as it defaults to Counts.
Line Chart
The graphed portion of this chart shows the count of transfers per week. The data underneath breaks it down into useful statistics regarding the time to process certain tasks and the value of inventory.
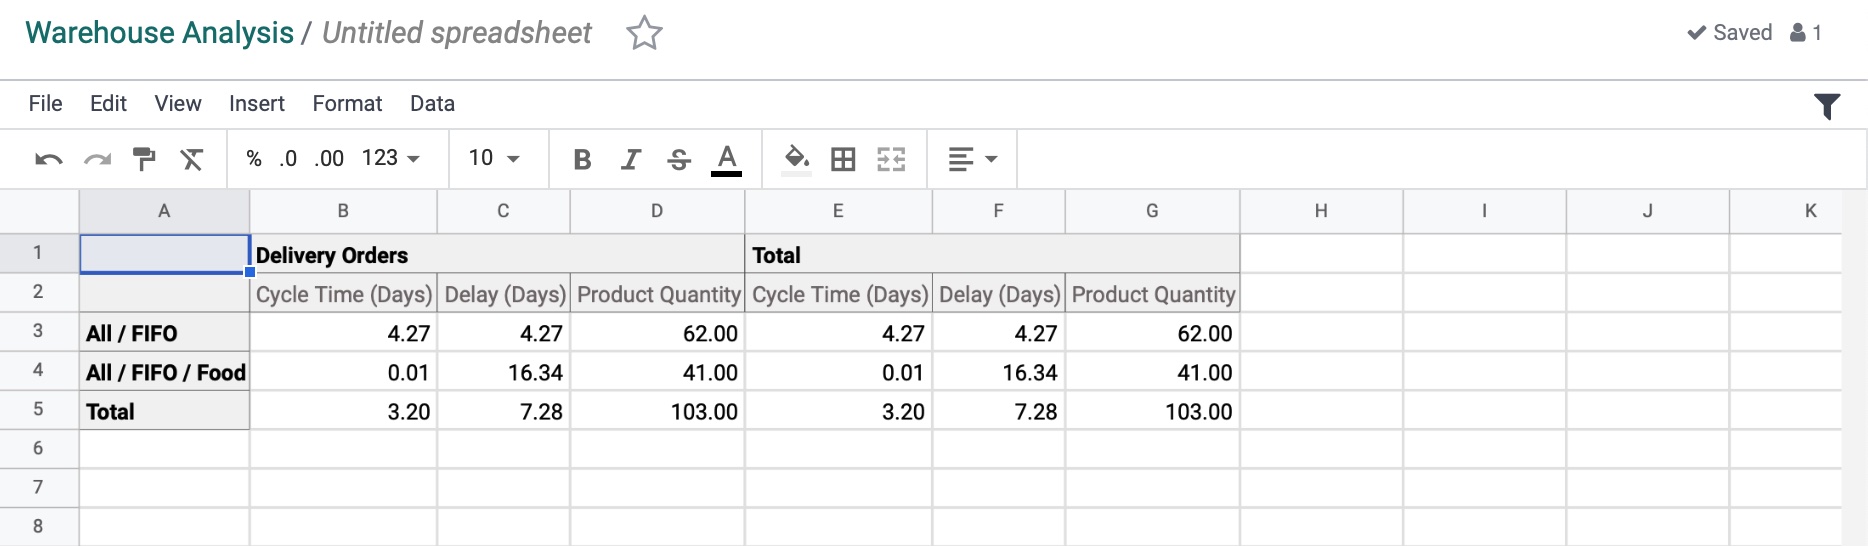
Pivot Table
This table shows the Average (Days): Cycle Time, Delays, and Product Quantity of Delivery Orders, Internal Transfers, and Receipts relating to the affected product categories.
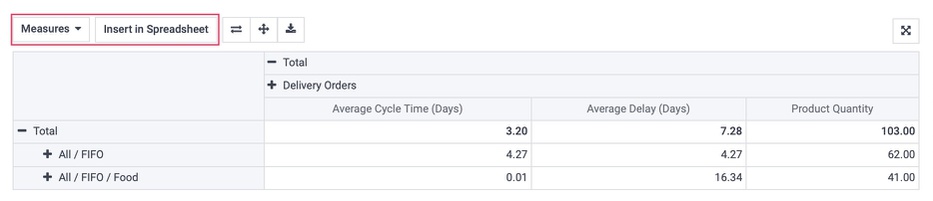
You can also use the Insert in Spreadsheet button to transfer the data into an editable spreadsheet or existing template.
To learn more about spreadsheets, please review our Spreadsheets documentation.
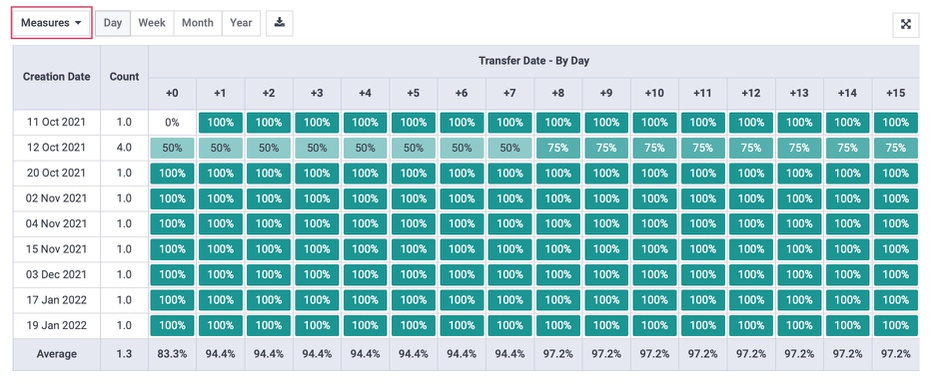
Data Table
This table breaks down daily Transfer date, by both Creation Date and Cycle Time, in days.
Inventory Report
To access this report, click Reporting > inventory report.
About This Report
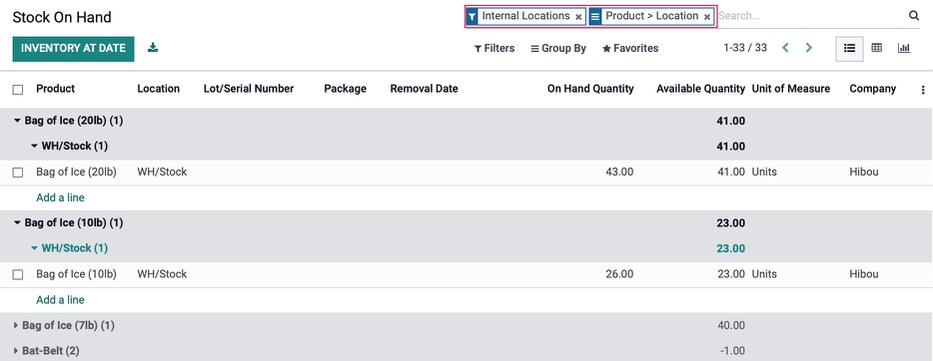
The purpose of this report is to show the state and location of your inventory throughout the process, whether it be during transfer, delivery, or receipt.
By using the three icons below the search bar, you can change the visual display type from List to Pivot Table or Graph Chart. You can use the Filter and Group By dropdowns to further customize your report.
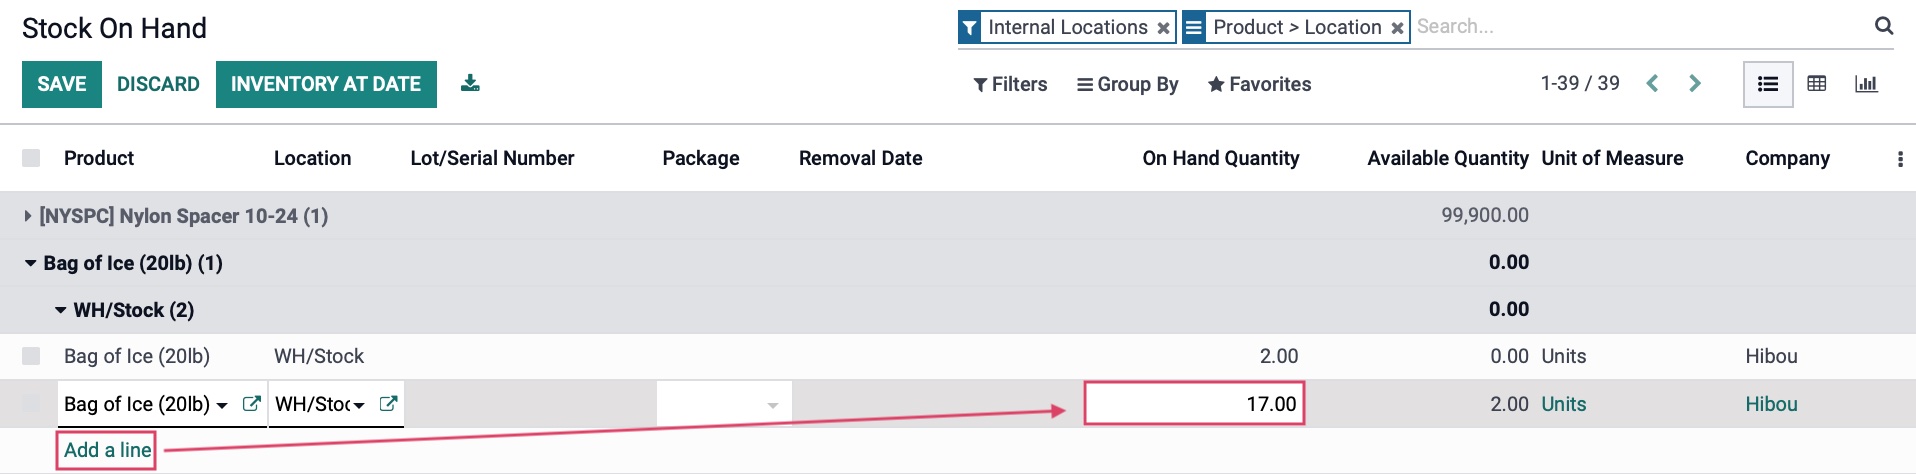
Inventory Adjustments
Clicking Add a Line will allow you to manually add in inventory on the fly. You will be able to indicate the following:
Product
Location
On Hand Quantity
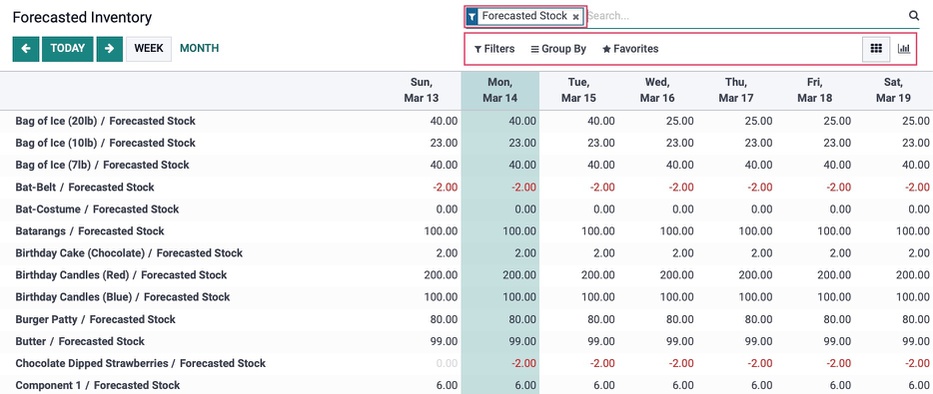
Forecasted Inventory
To access this report, click Reporting > Forecasted Inventory.
About This Report
The purpose of this report is to give you an overview of the stock you'll have on hand on any given day, displayed by the week or month.
Use the two icons below the search bar to change the visual display type from Grid to Graph Chart. Use the Filter and Group By dropdowns to further customize your report.
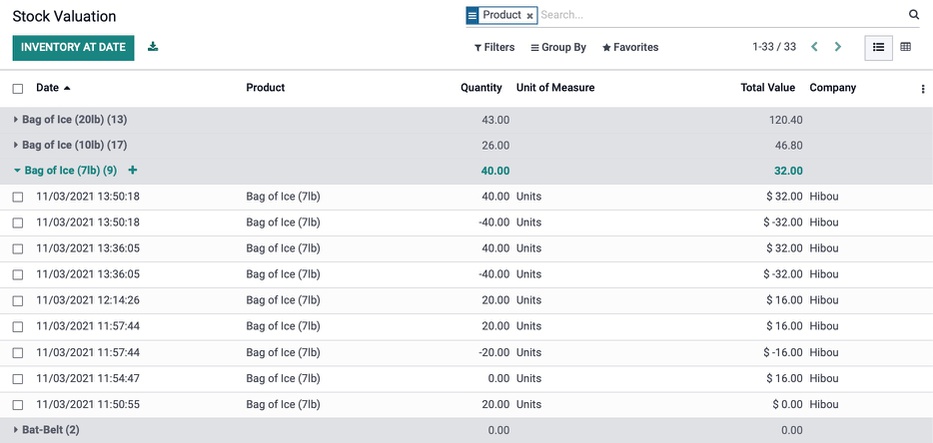
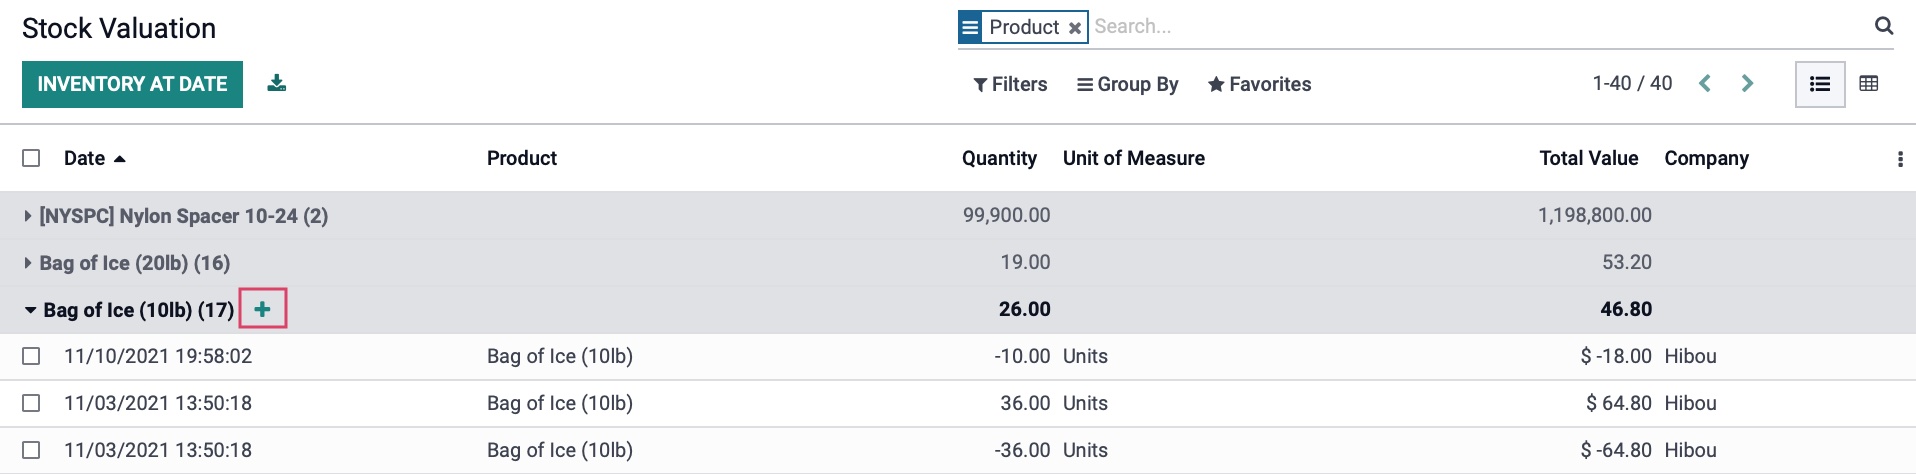
Inventory Valuation
To access this report, click Reporting > inventory valuation.
About This Report
The purpose of this report is to give you the stock count and total value of products on any given date. By default, the list will be grouped by product, unless otherwise configured. To see data for a specific date, click Inventory at Date and enter your desired date. You can also Export All data from the report for use outside of Odoo.
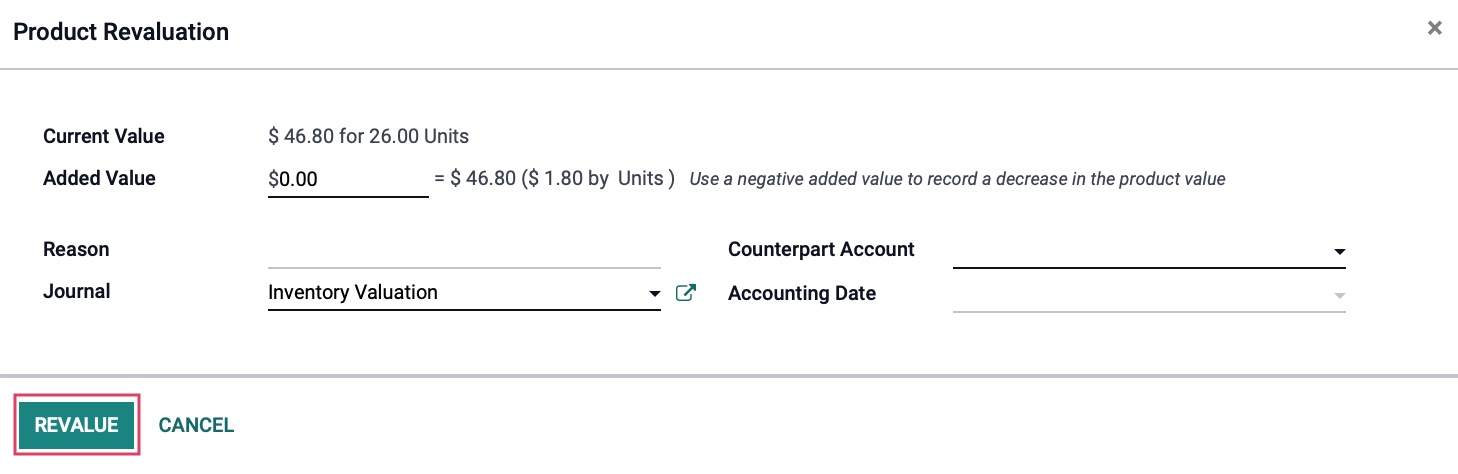
Product Revaluation
For Product Valuation changes, click on the button next to the product.
Define the following:
Current Value: This is the current value of the product.
Added Value: This is the change in value to all the items. A positive number represents an increase in value, while a negative number represents a decrease.
Reason: Enter in a reason for the product revaluation.
Journal: This will default to the Stock Journal set on the product's product category.
Counterpart Account: This is the account that will record the change in value.
Accounting Date: This will default to today's date if left empty.
When you are done, click Revalue
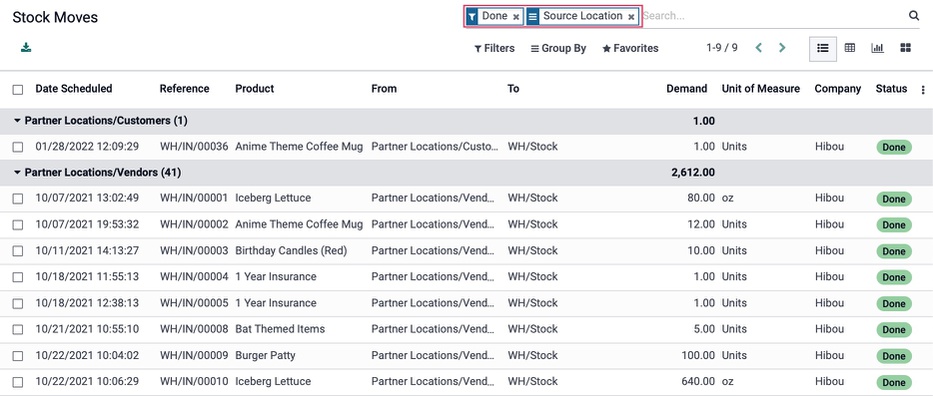
Stock Moves
To access this report, click Reporting > stock moves. This reporting option is only available if in Debug mode.
About This Report
The purpose of this report is to give you the stock count and total value of products on any given date. By default, the list will be grouped by the Source Location and stock moves in the Done status, unless otherwise configured. You can Export All data from the report for use outside of Odoo.
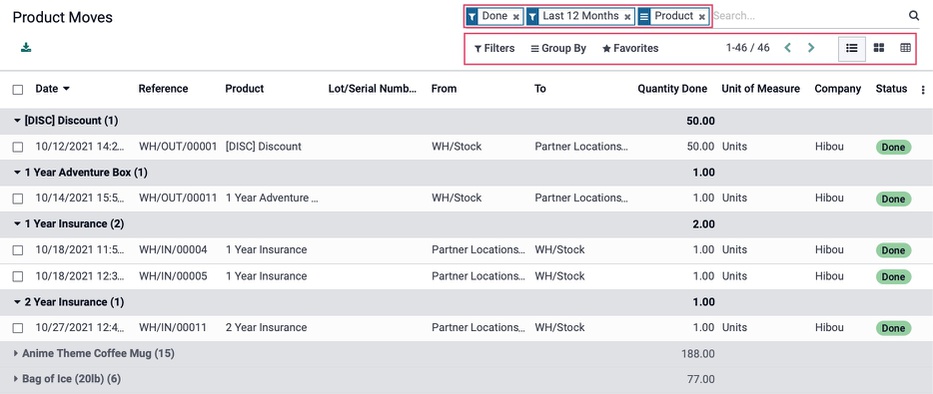
Product Moves
To access this report, click Reporting > Product Moves.
About This Report
The purpose of this report is to view the completed movement of your inventory. This report shows the product name, where it originated, and where to was moved to, along with other pertinent data.
Use the three icons below the search bar to change the visual display type from List to KanBan or Pivot view. Use the Filter and Group By dropdowns to further customize your report. By default, the list will be filtered to moves Done in the Last 12 Months and be grouped by Products.