Inventory : Reporting
Purpose
The purpose of this document is to review all preconfigured Inventory Reports and their usage. To review the Odoo 13 Inventory report options and features, please review Odoo Essentials: Odoo Navigation Overview. The documentation on that page will help you tailor this, and all, Odoo reports to your business needs.
Process
To get started, navigate to the Inventory app.
Warehouse Analysis
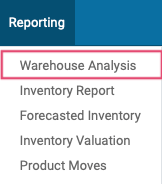
To access this report, click Reporting > Warehouse Analysis from the top menu.
About This Report
The purpose of this report is to give an overall view of the efficiency of your warehouse by reporting process times and financial data.
The default analyzed data will be transfers done in the last 30 days and will be broken down into three different visual reports. Using the Measures dropdown, each report can be modified to display Delay or Product Quantity in place of Cycle Time.
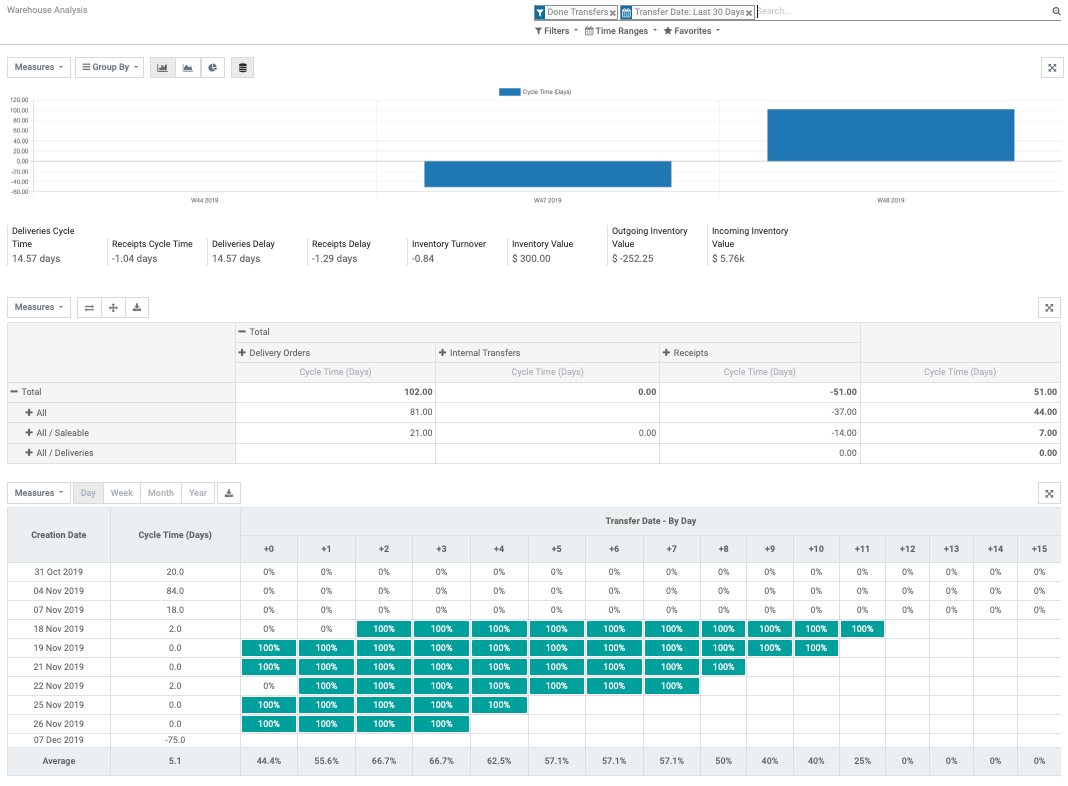
Line Chart: The graphed portion of this chart shows the count of transfers per week. The data below breaks it down into useful statistics regarding the time it takes to process certain tasks and the value of inventory.
Pivot Table: This table shows the Cycle Time, in days, of Delivery Orders, Internal Transfers, and Receipts relating to the affected product categories.
Data Table: This table breaks down daily Transfer date, by both Creation Date and Cycle Time, in days.
Inventory Report
To access this report, click Reporting > inventory report from the top menu.
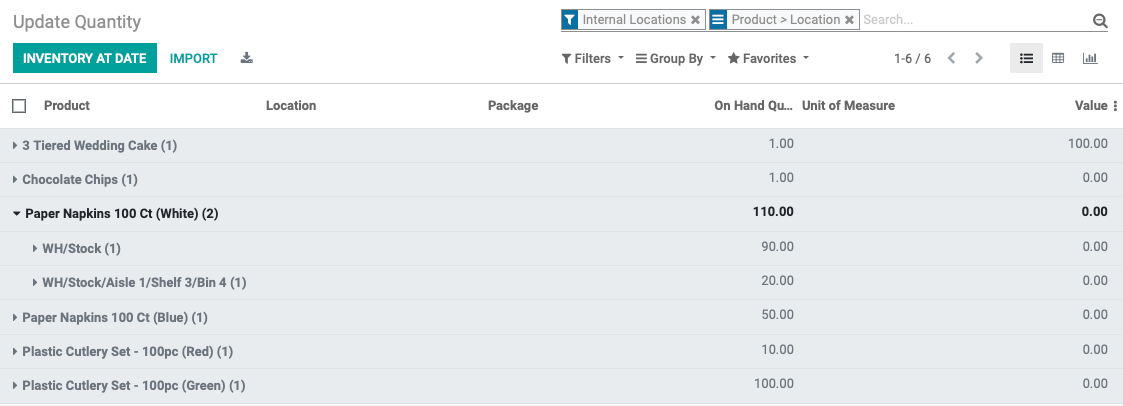
About This Report
The purpose of this report is to show the state and location of your inventory throughout the process, whether it be during transfer, delivery, or receipt.
By using the three icons below the search bar, you can change the visual display type from List to Pivot Table or Graph Chart. You can use the Filter and Group By dropdowns to further customize your report.
Forecasted Inventory
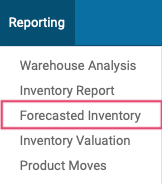
To access this report, click Reporting > Forecasted Inventory from the top menu.
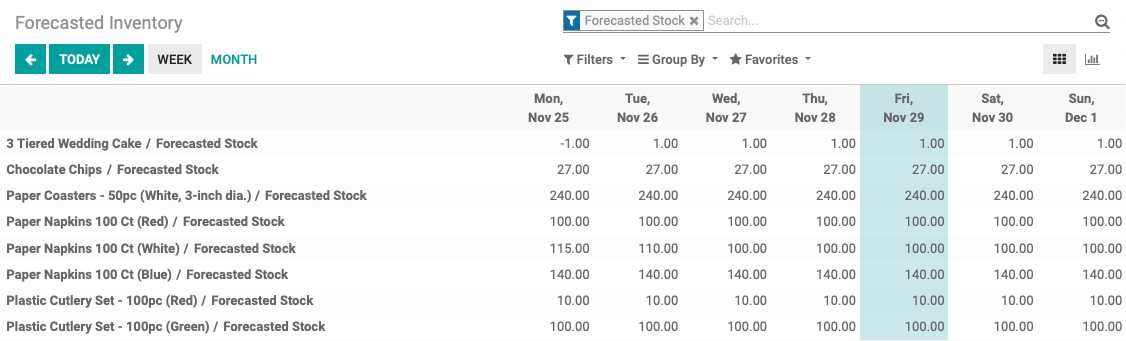
About This Report
The purpose of this report is to give you an overview of the stock you'll have on hand on any given day, displayed by the week or month.
By using the two icons below the search bar, you can change the visual display type from List to Graph Chart. You can use the Filter and Group By dropdowns to further customize your report.
Inventory Valuation
To access this report, click Reporting > inventory valuation from the top menu.
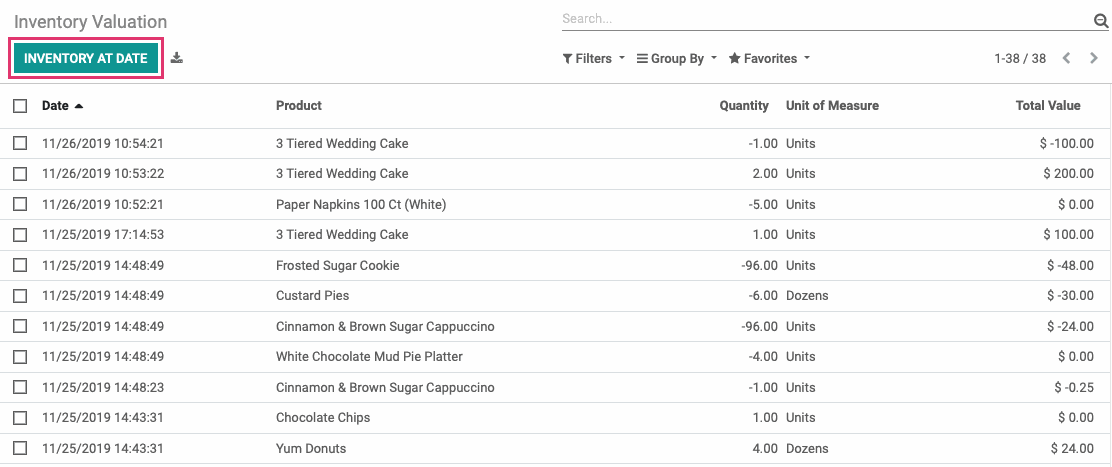
About This Report
The purpose of this report is to give you the stock count and total value of products on any given date. To see data for a specific date, click Inventory at Date and enter your desired date. You can also Export All data from the report for use outside of Odoo.
Product Moves
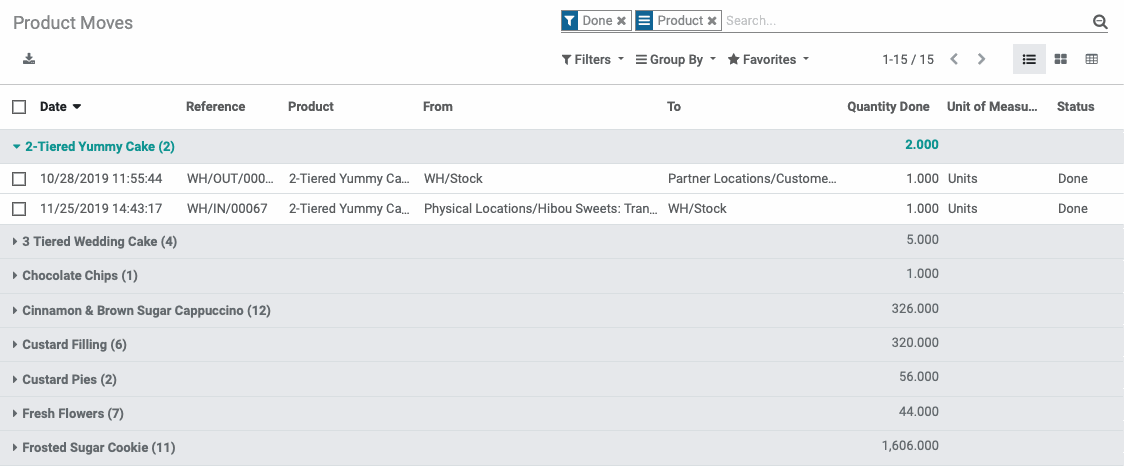
To access this report, click Reporting > Product Moves from the top menu.
About This Report
The purpose of this report is to view the completed movement of your inventory. This report shows the product name, where it originated, and where to was moved to, along with other pertinent data.
By using the three icons below the search bar, you can change the visual display type from List to KanBan or Graph Chart. You can use the Filter and Group By dropdowns to further customize your report.