Inventory : Reporting
Purpose
This document reviews all pre-configured Inventory Reports and their usage. To review the Odoo 16 Inventory report options and features, please review Odoo Essentials: Odoo Navigation Overview. The documentation on that page will help you tailor this, and all Odoo reports to your business needs.
Process
To get started, navigate to the Inventory app.
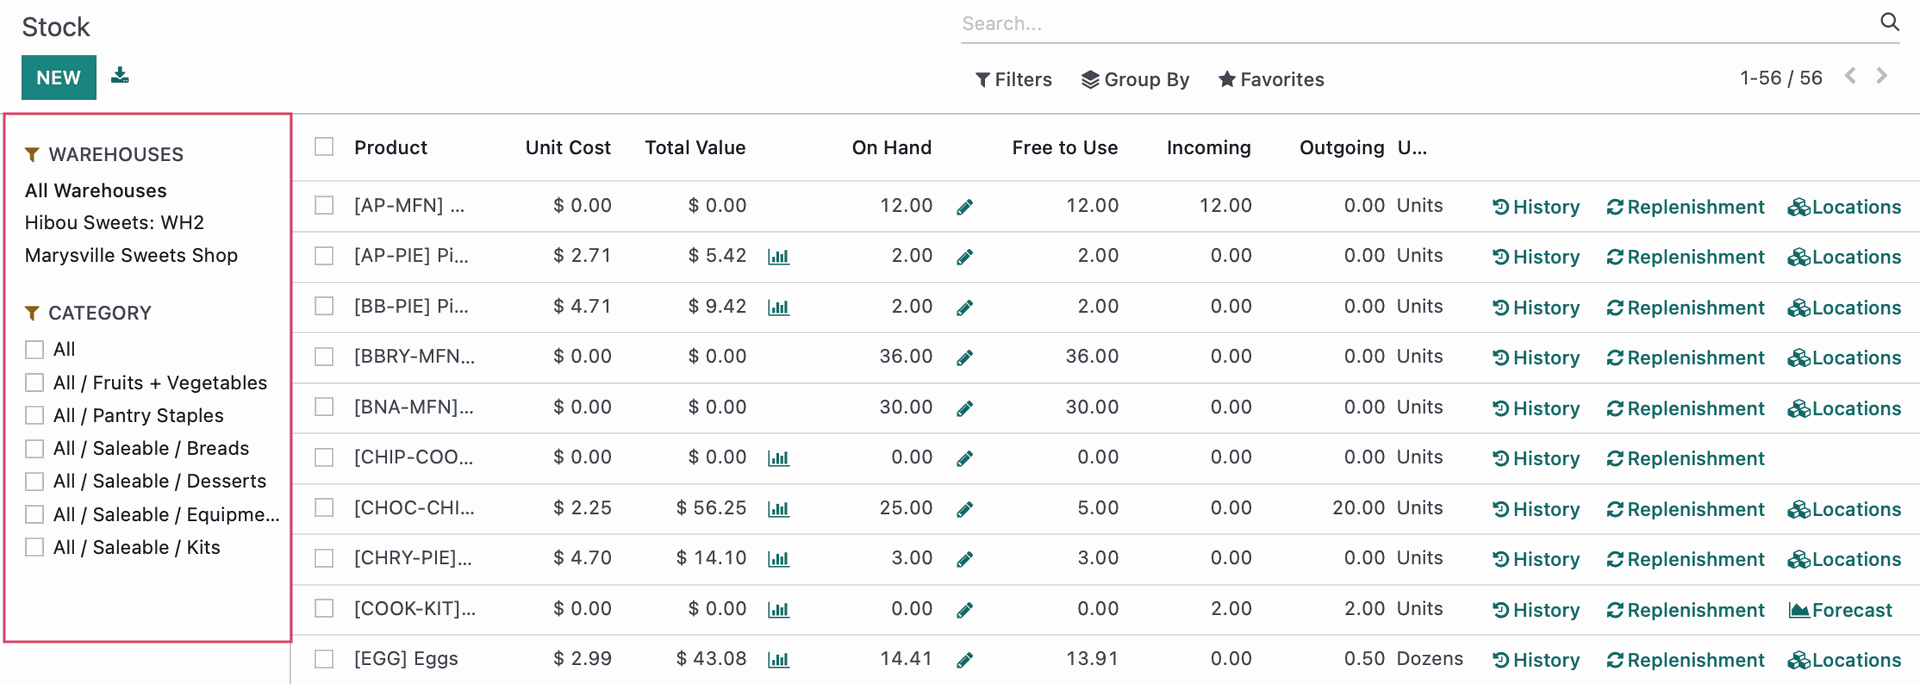
Stock
This report gives an overall view of all products and can be filtered by using the section on the left to specify specific Warehouses or Product Categories. From here, you can see cost, value, available quantities, quantities incoming from confirmed Purchase Orders, and outgoing quantities from confirmed Sale Orders.
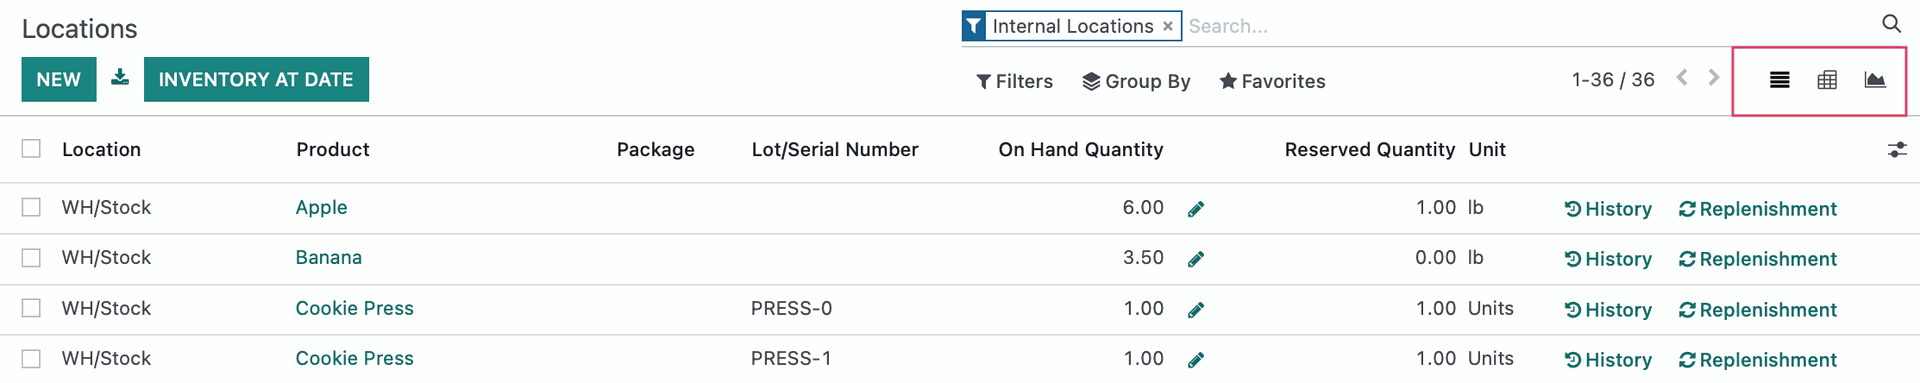
Locations
Moves History
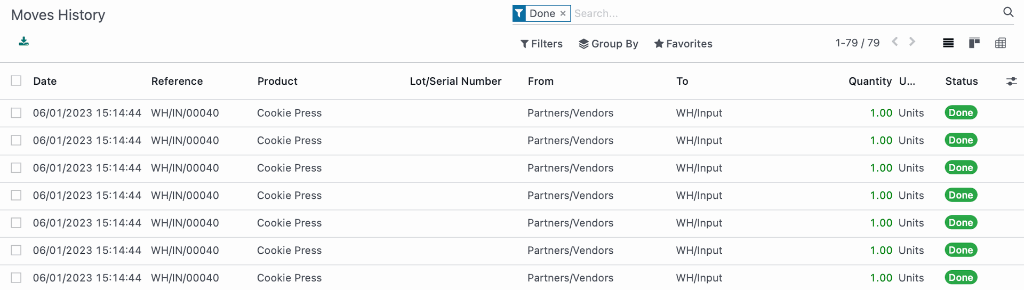
To access this report, click REPORTING > MOVES HISTORY. This report shows the From and To locations sorted by product and Reference of the transfer. This report also shows the individual lines for each transfer.
Stock Moves
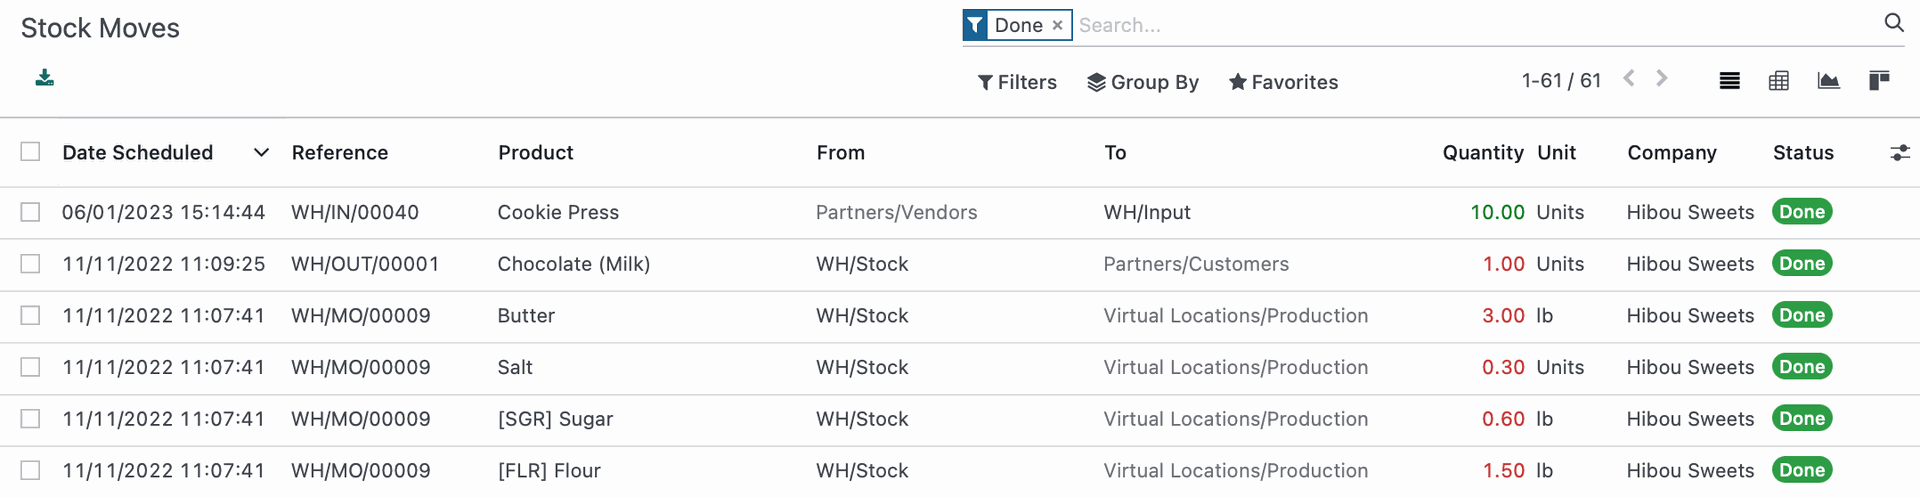
You must be in Debug mode to access this menu item. To access this report, click REPORTING >STOCK MOVES. This report shows very similar information to the Moves History report, however these lines are grouped by transfer, not individual lines on each transfer.
Valuation
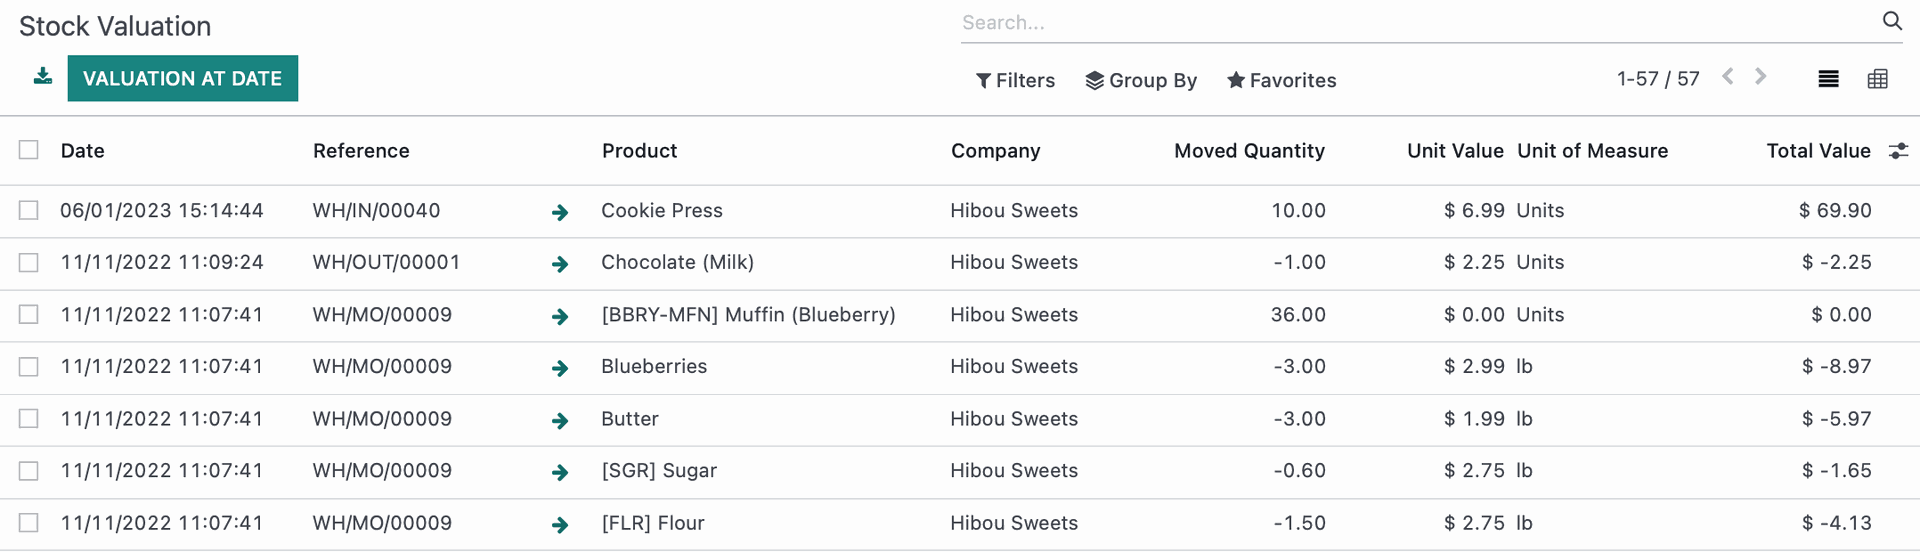
You must be in Debug mode to access this menu item. To access this report, click Reporting > valuation. The purpose of this report is to give you the stock count and total value of products on any given date. To see data for a specific date, click VALUATION AT DATE and enter your desired date. You can also Export All data from the report for use outside of Odoo.
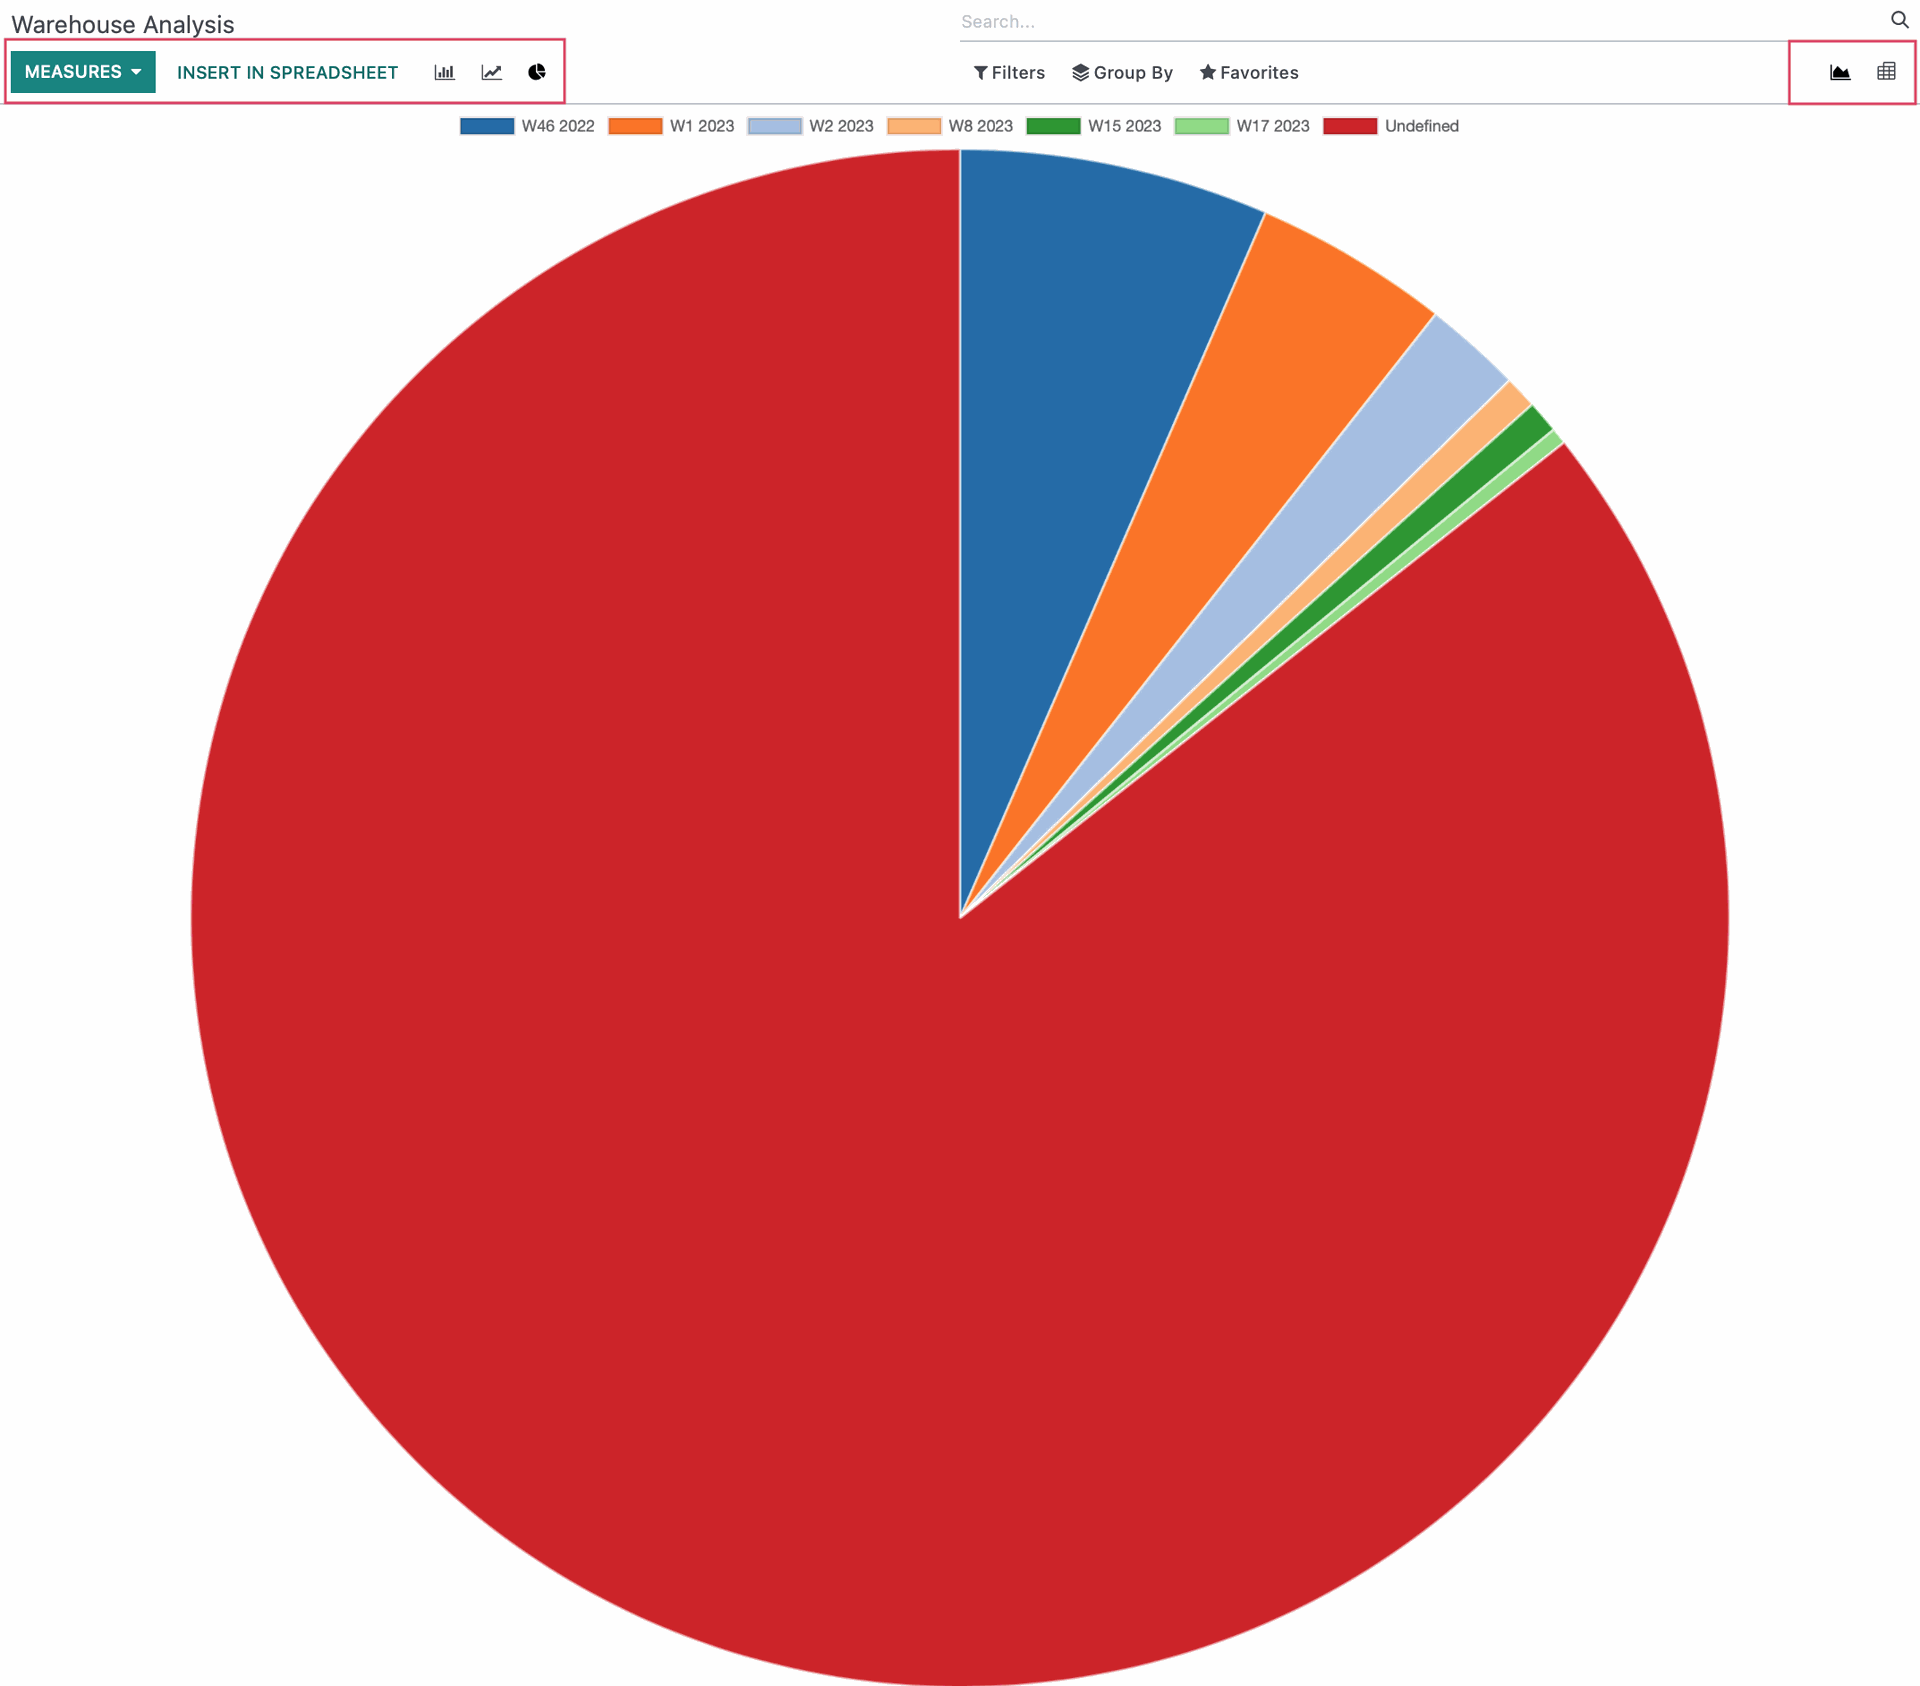
Performance
This report was formerly known as Warehouse Analysis. It can be viewed by going to REPORTING > PERFORMANCE. This report allows you to select different Measures to visualize transfers and values of the products in your Inventory. Selecting different Measure will change the information represented and can be viewed in a Bar, Line, or Pie graph. You can also select a different view by selecting on the top right either Graph (as shown) or a Pivot view which collects all of the data and displays it in a table.