Project: Reporting
Purpose
There are five preconfigured reports within the Project application. In this document, we'll go over each of them briefly.
Odoo reports often serve as a foundation, allowing you to further configure with the data and views most useful for you. Please refer to Odoo Essentials: Navigation to review what each icon represents and how to manage report data.
Process
Navigate to the Project app.
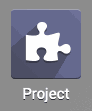
Tasks Analysis
Click Reporting > Tasks Analysis.
With the exception of the Pie Chart and Pivot Table, most views for this report will incorporate Project and Employee data. The third dataset can be adjusted using the Measures menu.
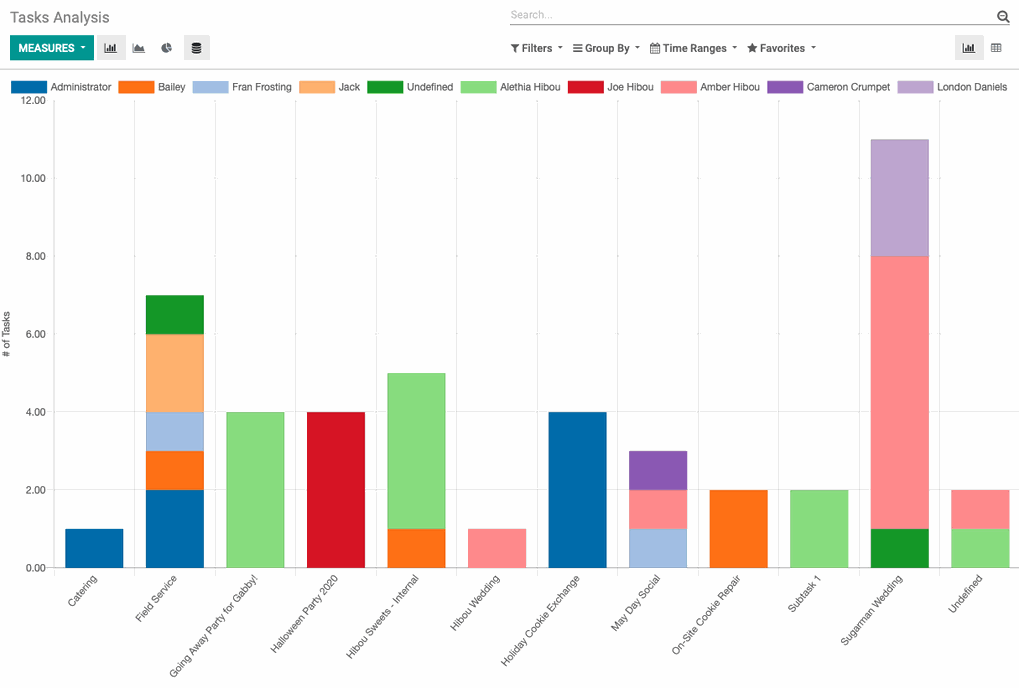
Planning Analysis
Click Reporting > planning Analysis.
This bar graph report that, by default, displays data of Employees and their hours worked across a given time range. There are a variety of datasets you can add or remove using the MEASURES menu.
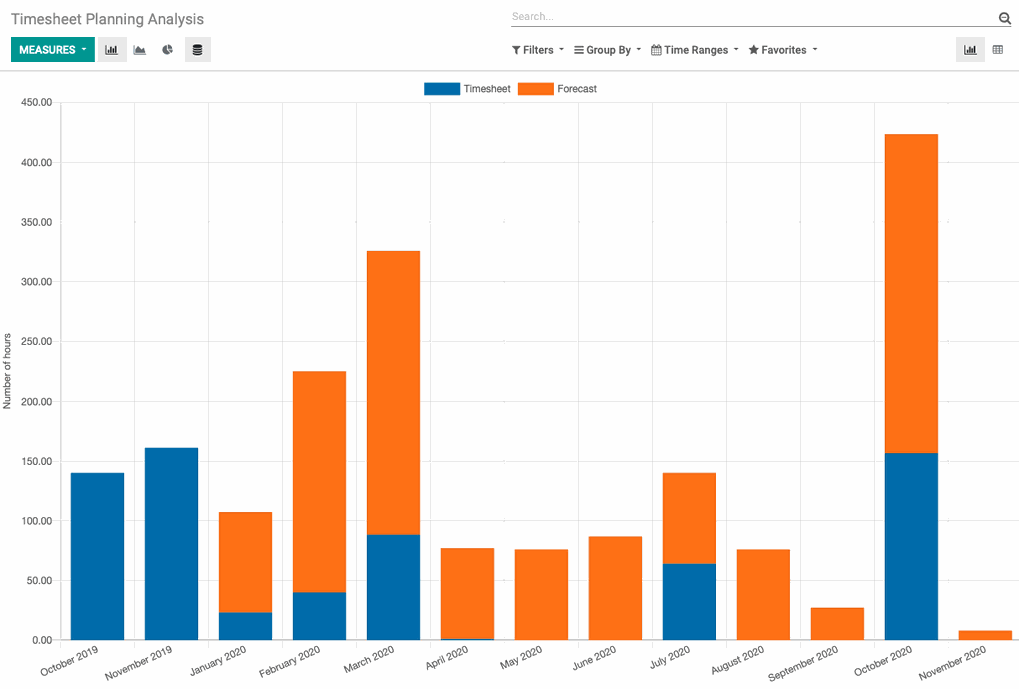
Timesheet Planning Analysis
Click Reporting > timesheet planning Analysis.
By default, this is a bar graph report that displays Employees and their hours worked. You can use the MEASURES menu to change the Number of Hours to Count of Tasks.
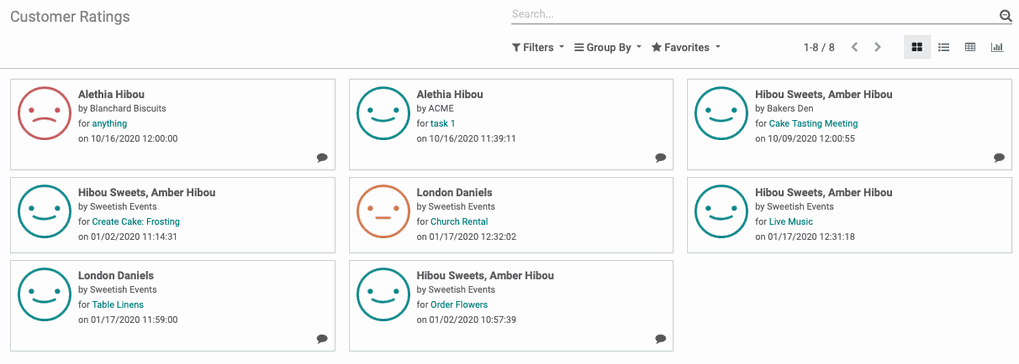
Customer Ratings
Click Reporting > Customer Ratings.
By default, this report shows a Kanban card for each customer rating submitted. You can adjust the view with the respective icons under the search field.
See Project Ratings documentation for further information.
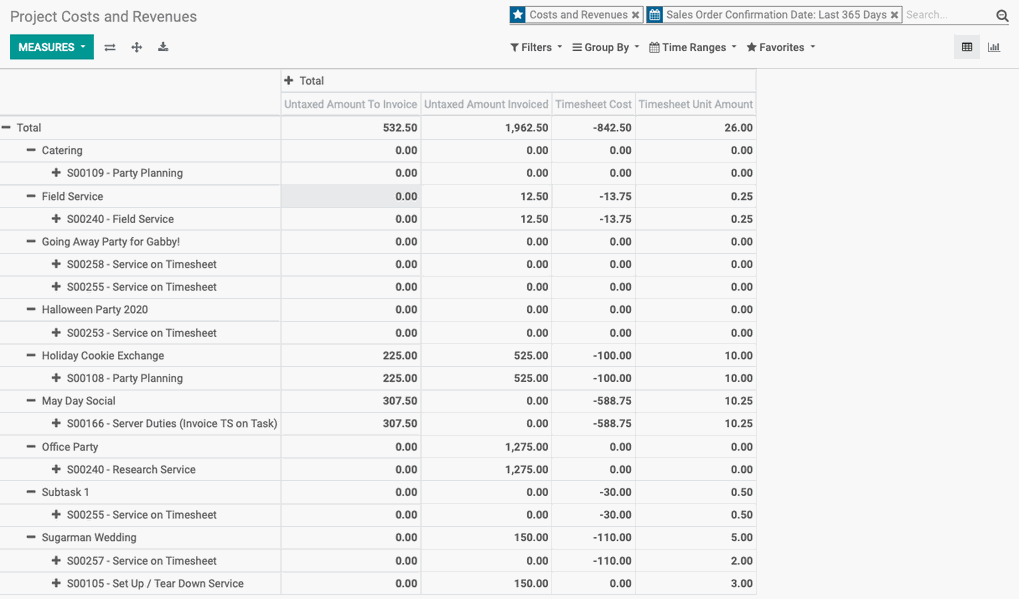
Project Costs and Revenues
Click Reporting > Project Costs and Revenues.
This report allows you to see the profitability of projects by incorporating different measures into the pivot table.