Purchase: Reporting
Purpose
The purpose of this documentation is to review the features and data-views offered by Reporting in the Odoo 14 Purchase app.
Process
To begin, navigate to the Purchase app.
Once there, click REPORTING.
Filters
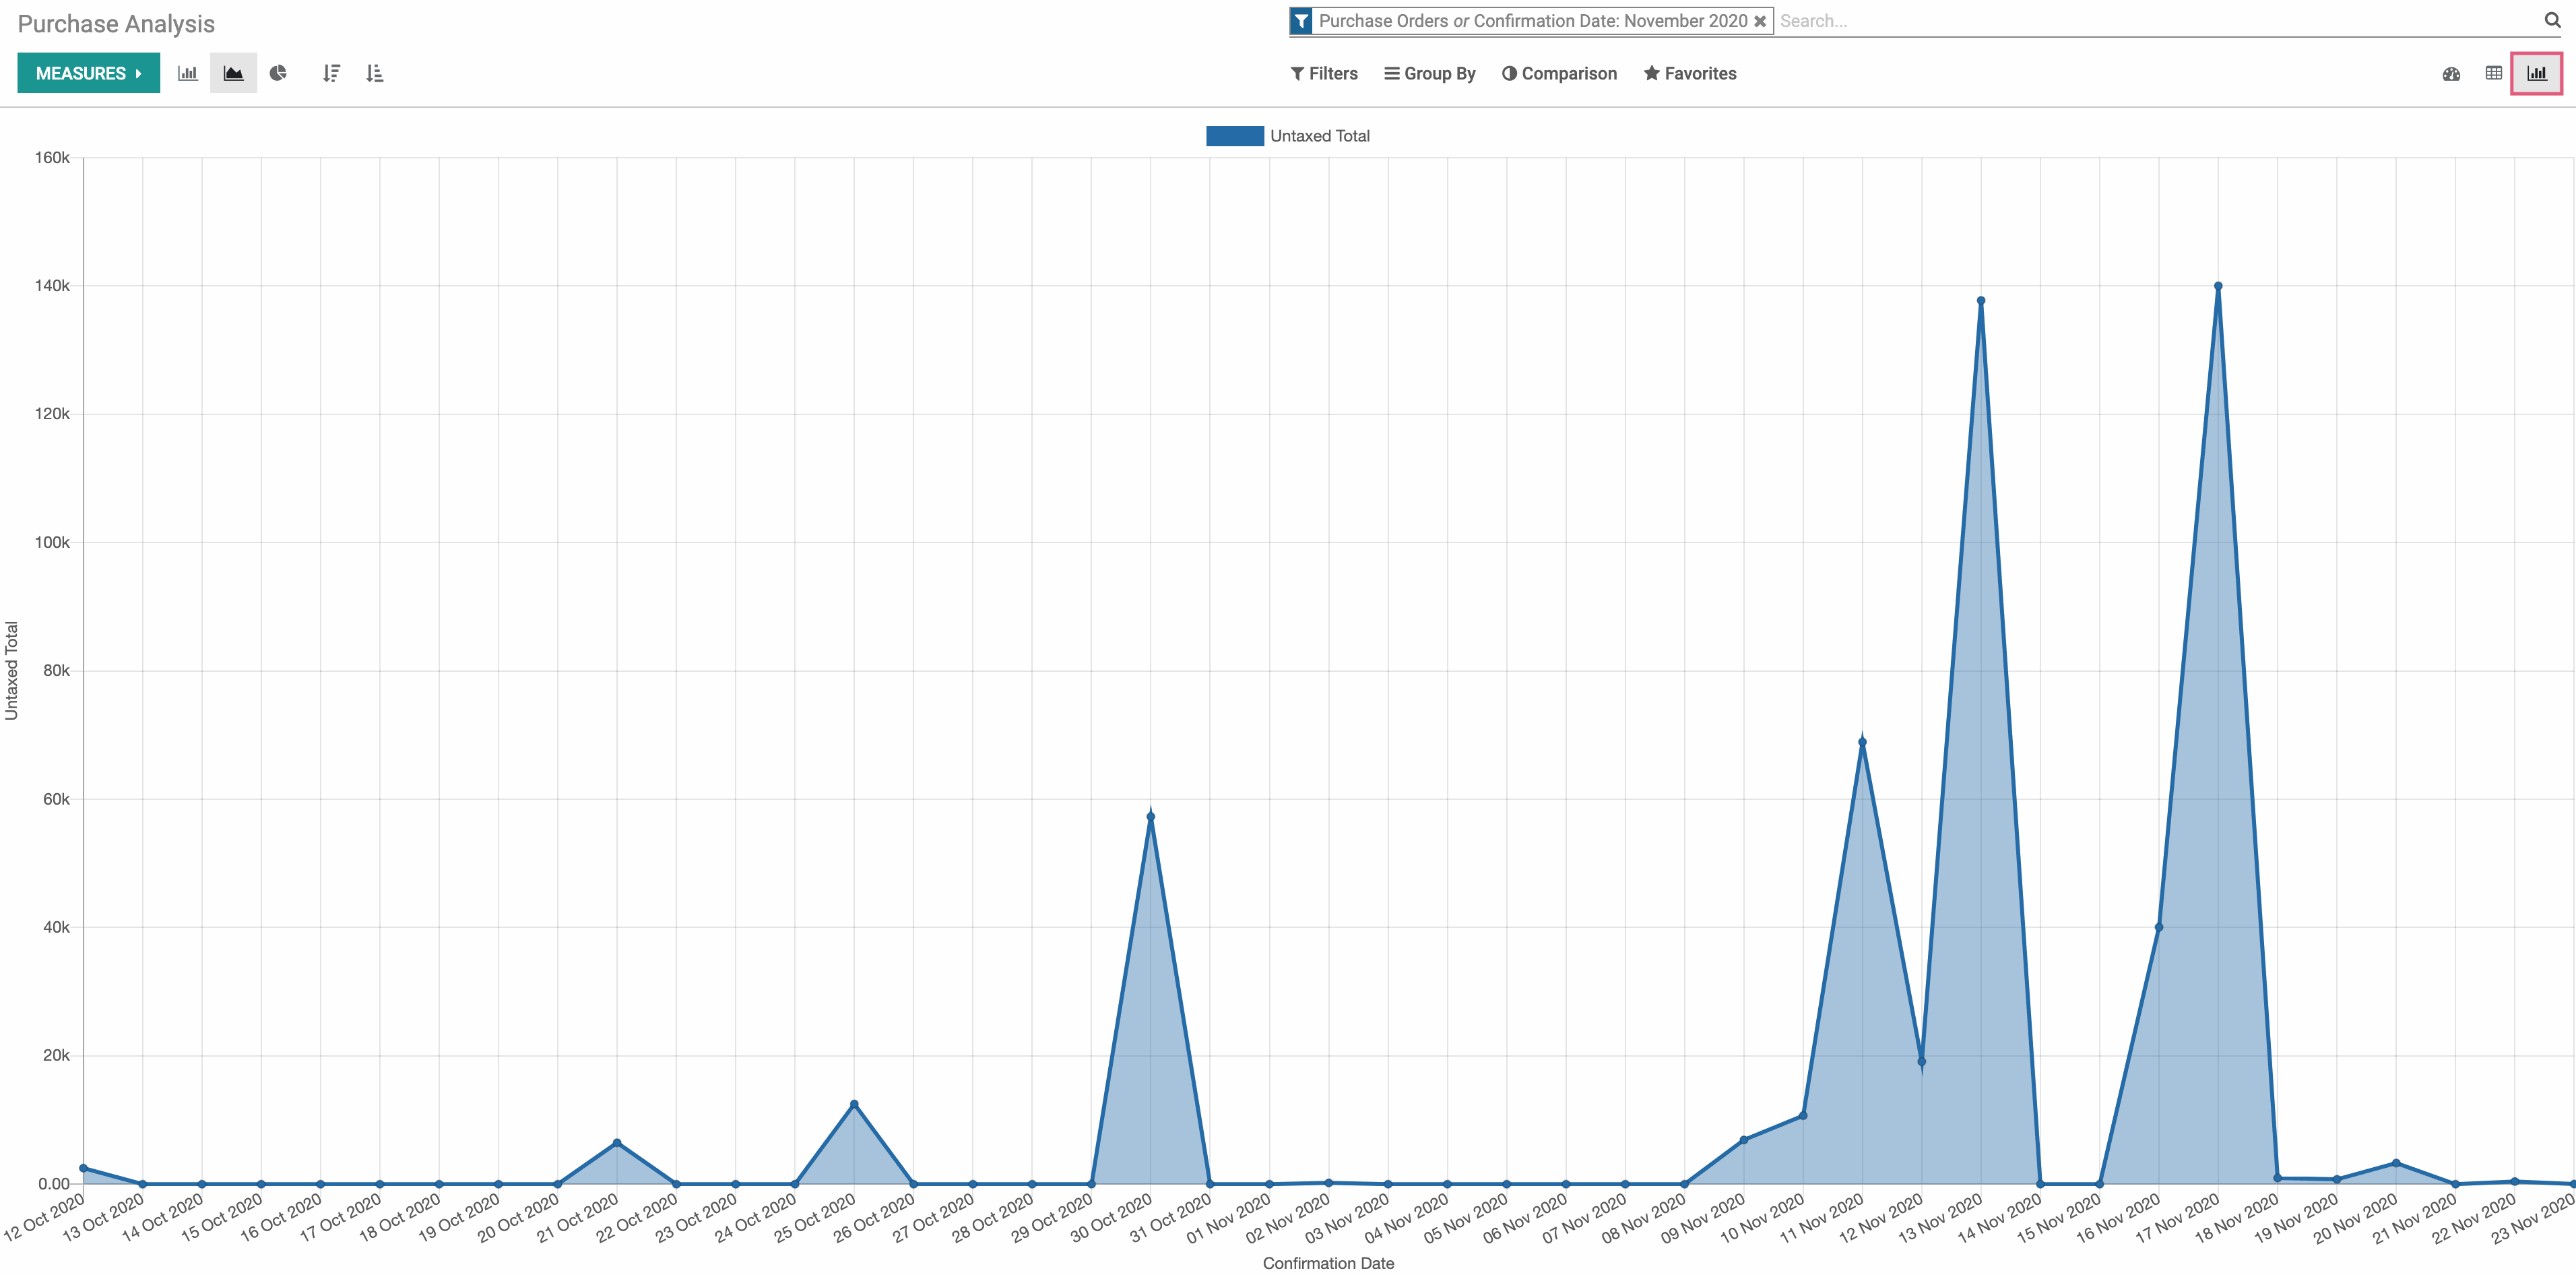
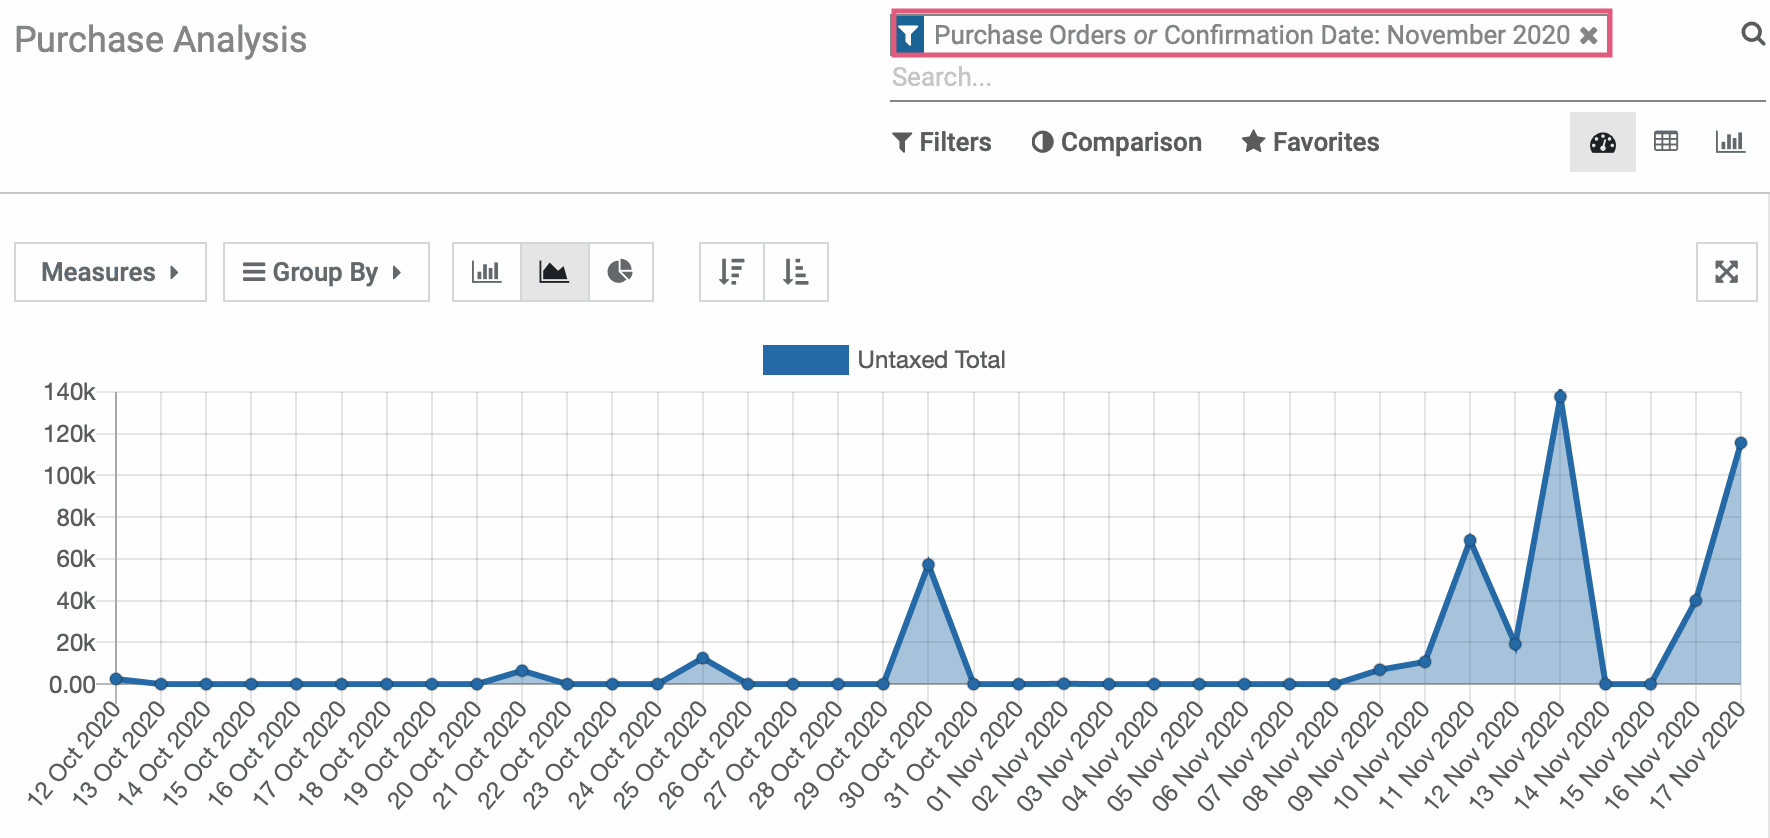
When you first open this page, your default data will be for purchase orders that have been confirmed within the last 30 days. You can clear the filter by clicking the next to it.
Report Views
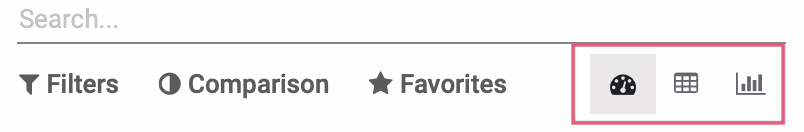
Nested under the search bar are options to tailor your view. If you don't see these options, click the looking glass to the right of the filter to expand it.
Filter Options
To the left of the Report Views section, you'll see three filter menus that will assist in creating tailored report views.
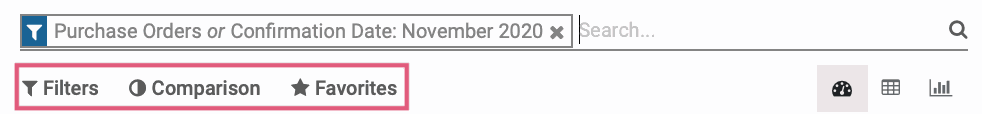
Under the Filters dropdown, there are five preset filters for this report: Request for Quotation, Purchase Orders, Confirmation Date Last Year, Order Date, and Confirmation Date. Use these options to narrow down your data.
Under the Comparison dropdown, there are two preset filters for this report: Confirmation Date: Previous Period and Confirmation Date: Previous Year. Use these options to narrow down your data.
Use the Favorites dropdown to save and access custom recordsets you'll use often.
View Options
To the right of this section, you'll see three icons that refer to the data view.
The Dashboard view is your default view and will give a full-scope view of the data you've selected. The first section can be further configured to display your data in several different ways:
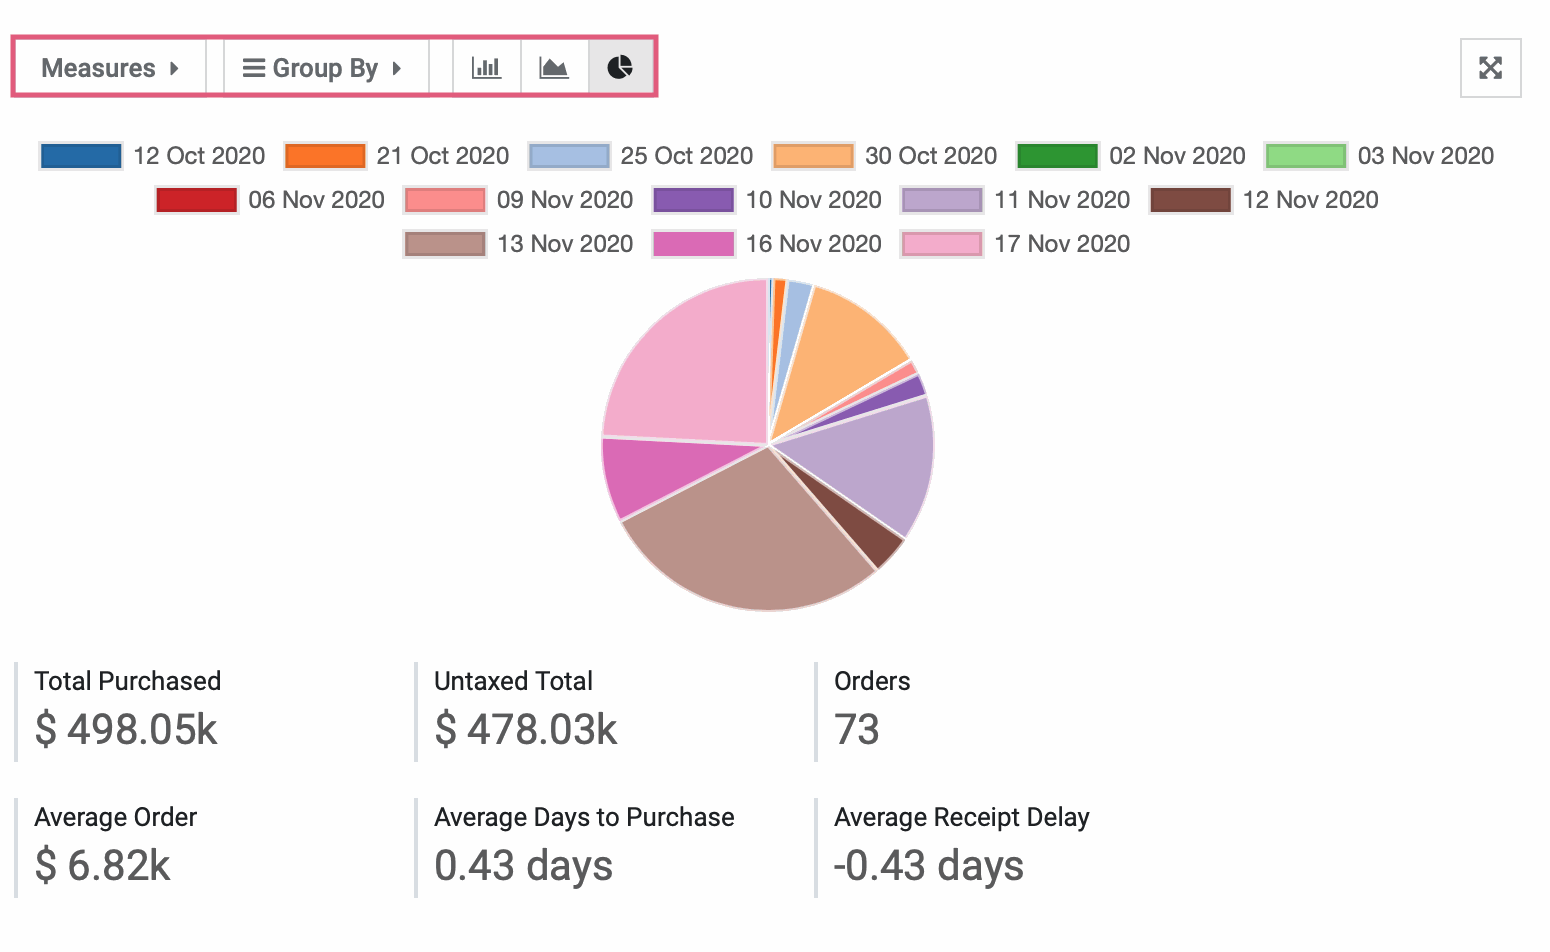
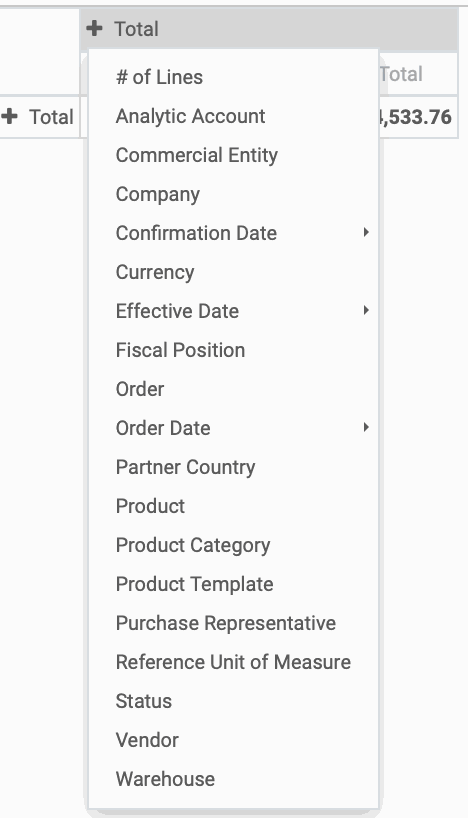
Measures: Modify the data included in your recordset. The selected measures for the report shown above are displayed at the bottom of the chart (Total Purchased, UntaxedTotal, Orders, Average Order and Average Receipt Delay).
Group By: Select how your data will be grouped.
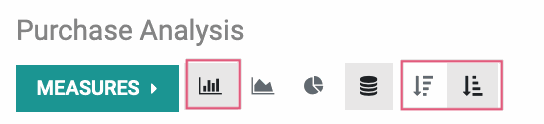
Bar Chart: This displays your data in a bar chart. This can be further modified using the Stacked feature.
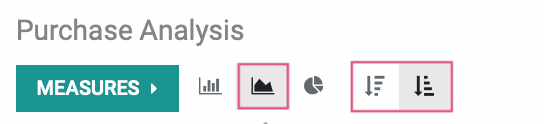
Line Chart: This displays your data in a line chart.
Pie Chart: This displays your data in a pie chart.
Good to Know!
Both the bar chart and line chart allow you to see your data in a descending or ascending view. However, the descending and ascending views do not apply to the pie chart.
The second section of the report is presented as a Pivot Table and can also be configured to your needs.
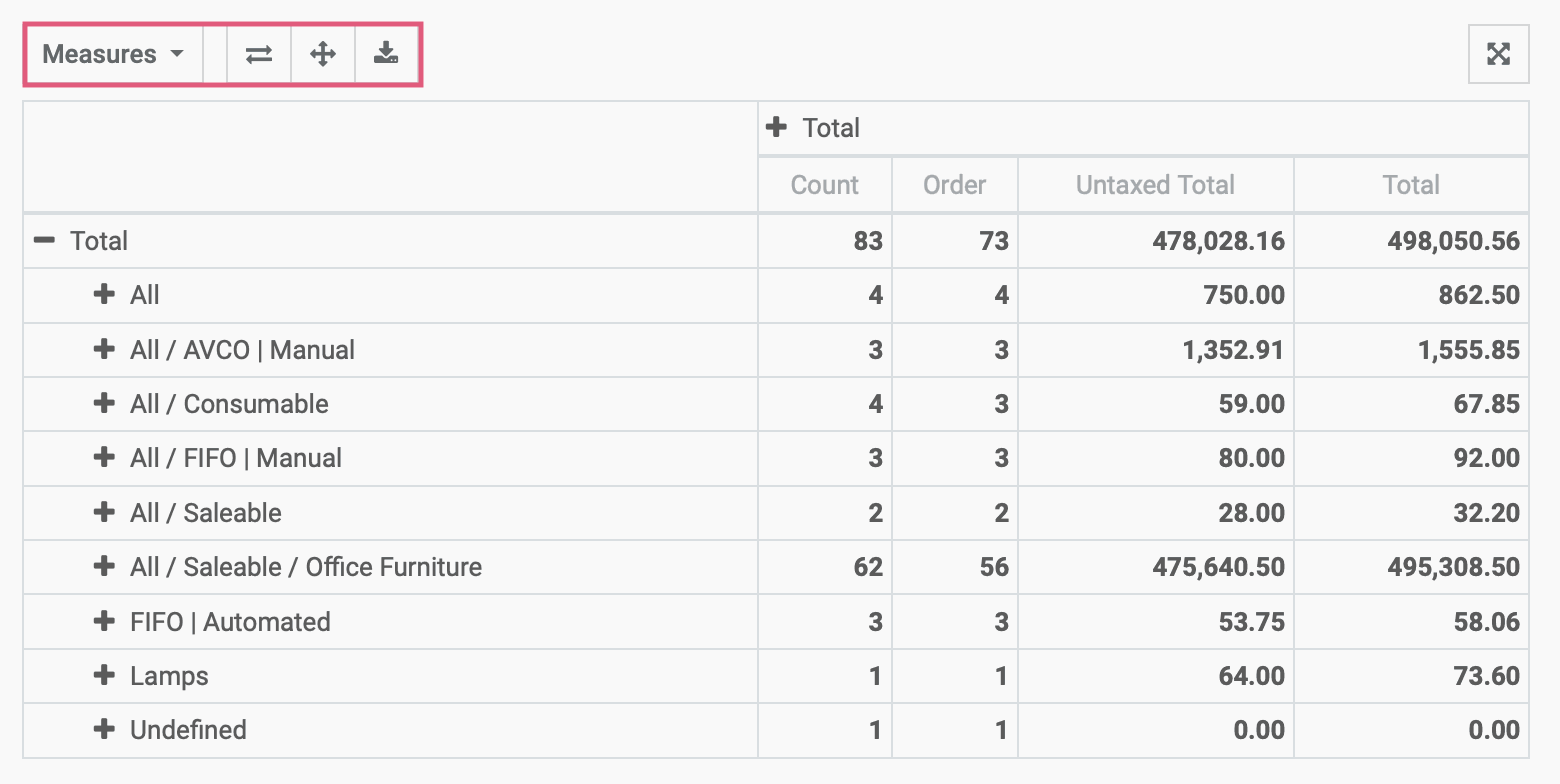
Measures: Modify the data included in your recordset.
Flip Axis: Switch the positions of your X and Y axes.
Expand: Expands data that is expandable.
Download xls: Allows you to download the data in your pivot table to an xls spreadsheet format.
Good to Know!
Odoo makes customizing pivot tables easy. Within any pivot table, use the and icons on the table, itself, to add or remove specific data. Be sure to save your report for later use. The following screenshot shows data that can be displayed in the pivot table after clicking the icon.
The third section of the report is presented as a Graph Chart and can also be configured to your needs.