Purchase: Reporting
Purpose
The purpose of this documentation is to review the features and data-views offered by the reporting menu in the Purchase application of Odoo 16.
Process
To begin, navigate to the Purchase app.
Default Filters
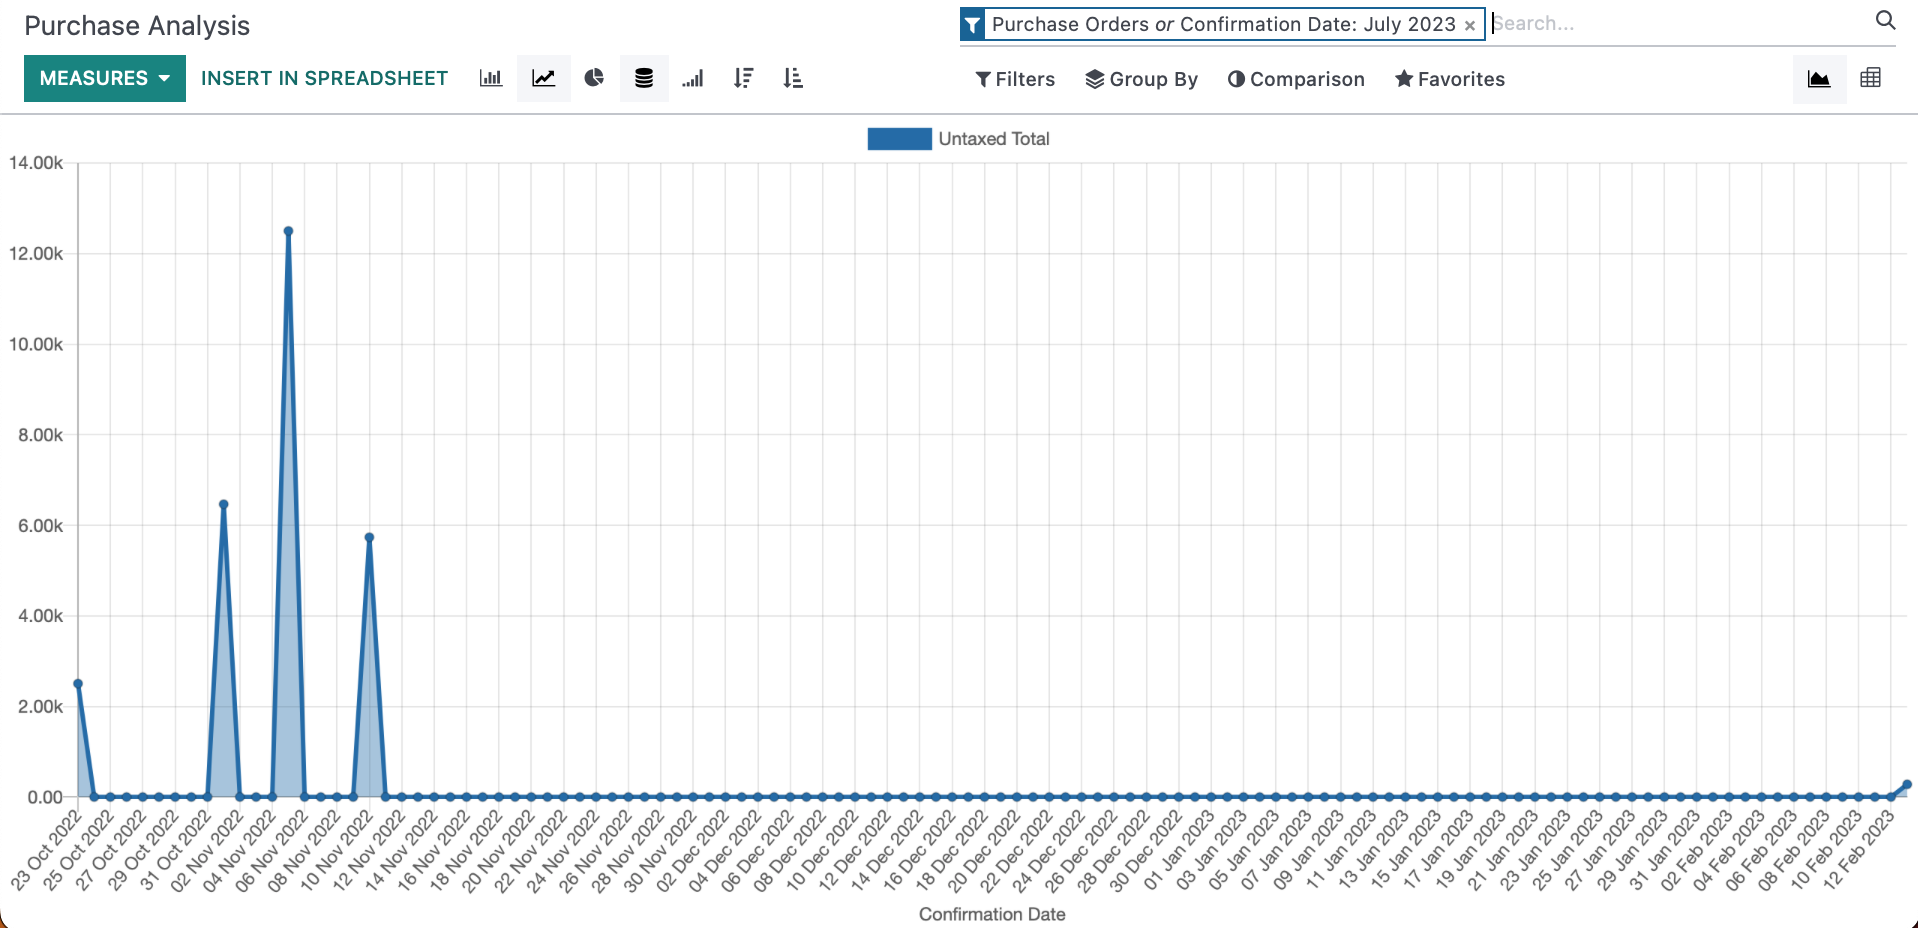
When you first open this reporting page, your default view will be Purchase Orders that have been confirmed in the current month. You can clear these filters by clicking the
Tailor Report Views
Nested under the search bar are options to tailor your view. If you don't see these options, click the Caret to the left of the filter option to expand it.
Filter Options
You'll see the following filter menus that will assist in creating tailored report views:
- Under the Filters dropdown, the following preset filters are available for this report: Purchase Orders and Confirmation Date. Select any options needed to narrow down the data.
- Use the Comparison dropdown to have your report show data from the previous period or year.
- Use the Group by dropdown to so a list of presets groups or create a custom one.
- Use the Favorites dropdown to save and access custom record sets you'll use often.
View Options
To the the right above the report, you will see different types of views to organize your data into.

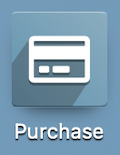
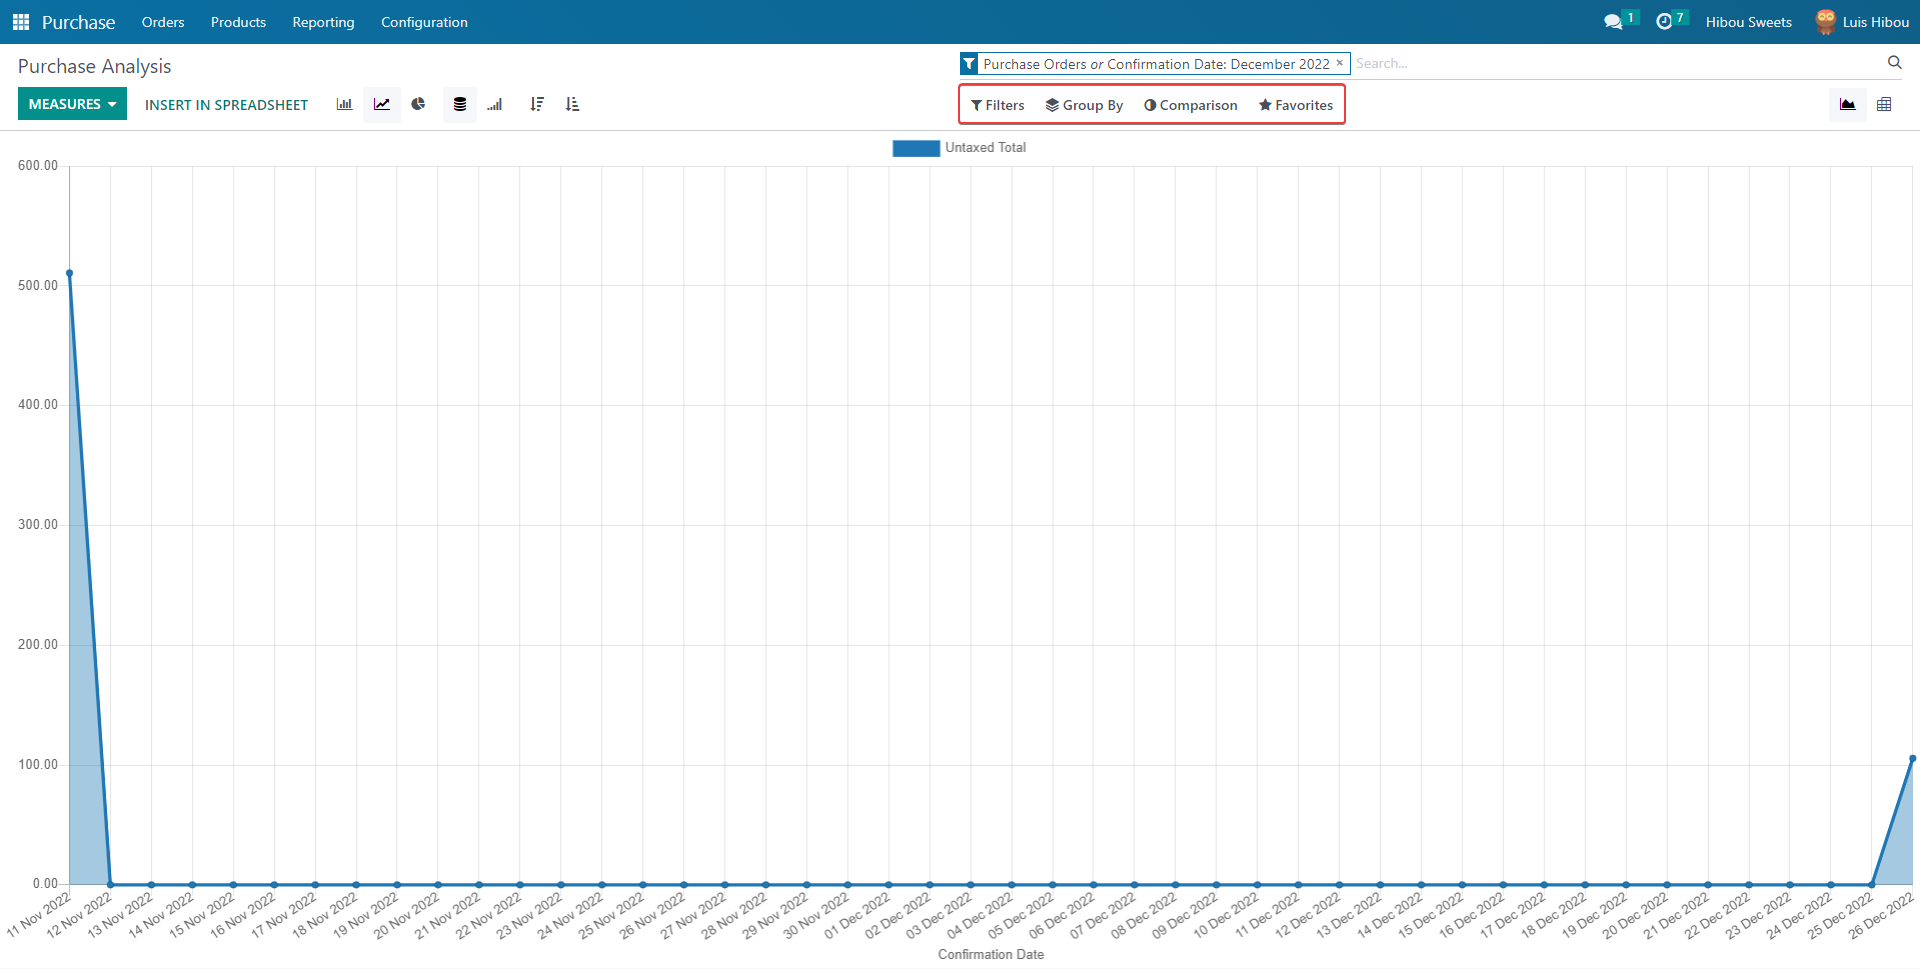
Graph View
The Graph view is your default view and will give a full-scope view of the data you've selected. The first section can be further configured to display your data in several different ways:
Measures: Modify the data included in your recordset. The selected measures for the report shown above are displayed at the bottom of the chart (Total Purchased, UntaxedTotal, Orders, Average Order).
- INSERT IN SPREADSHEET: This will allow you to export the data into a spreadsheet in Odoo. To learn more about this, please review our Spreadsheets documentation.
Bar Chart: This displays you data in a bar chart.
- This type of chart allows you to utilize the Stacked feature or organize the data by Descending or Ascending.
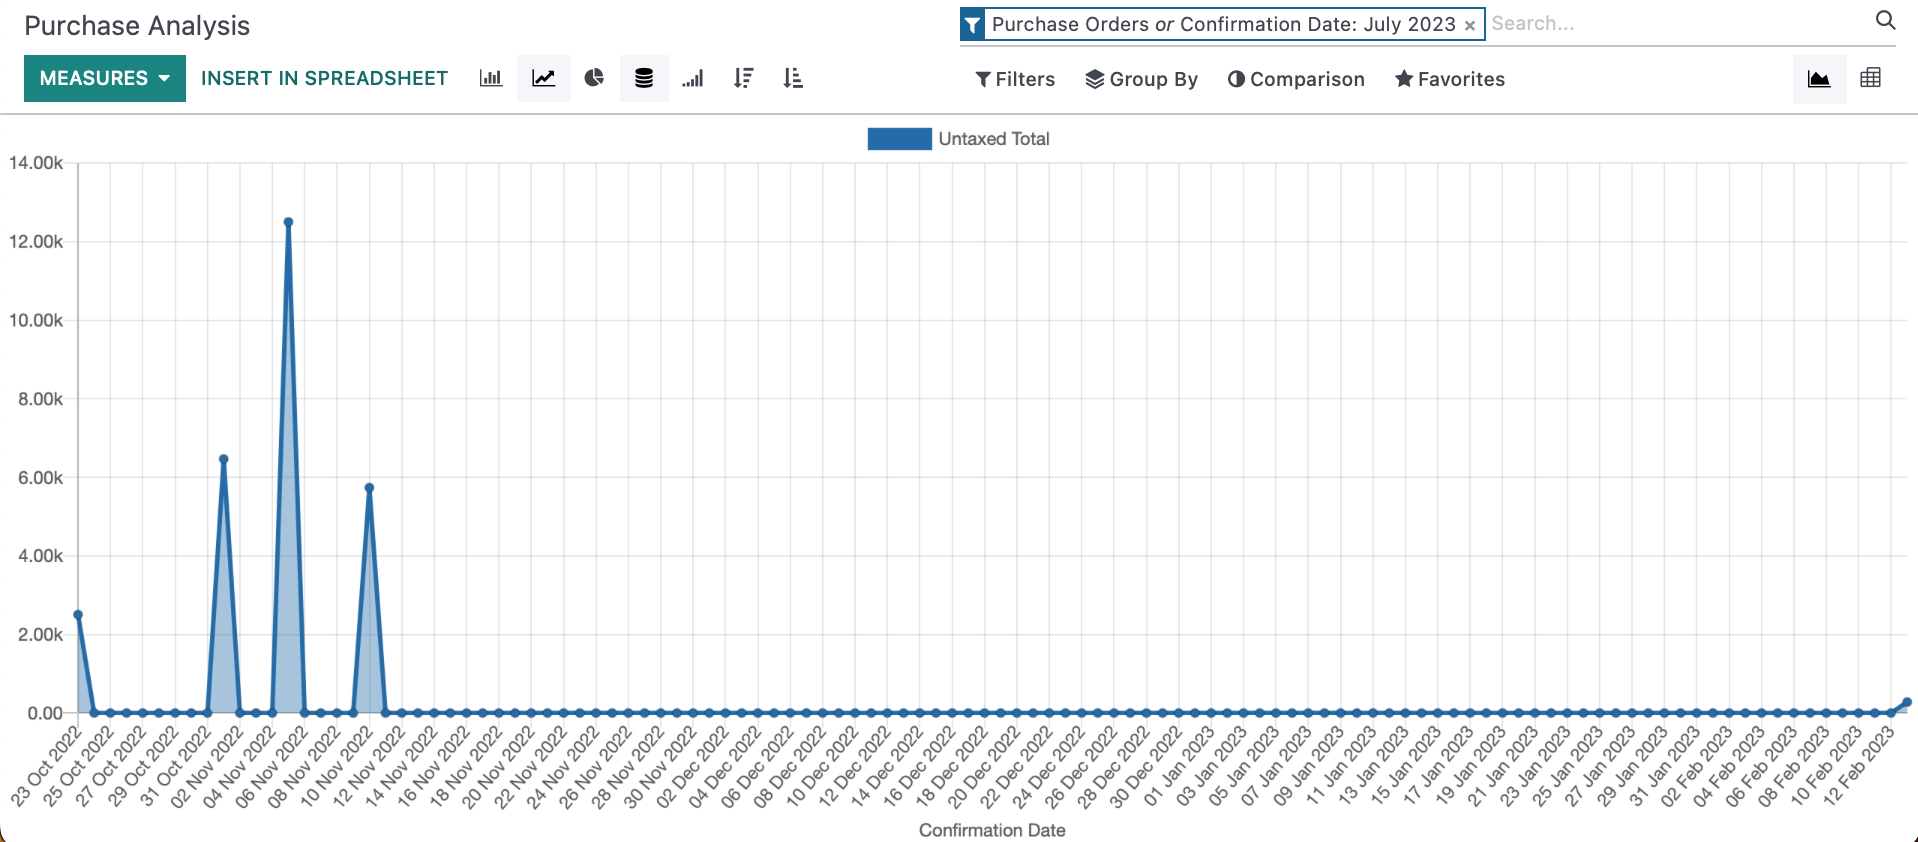
Line Chart: This displays your data in a line chart.
- This type of chart allows you to utilize the Cumulative feature and organize the data by Descending or Ascending.
- This type of chart allows you to utilize the Cumulative feature and organize the data by Descending or Ascending.
Pie Chart: This displays your data in a pie chart
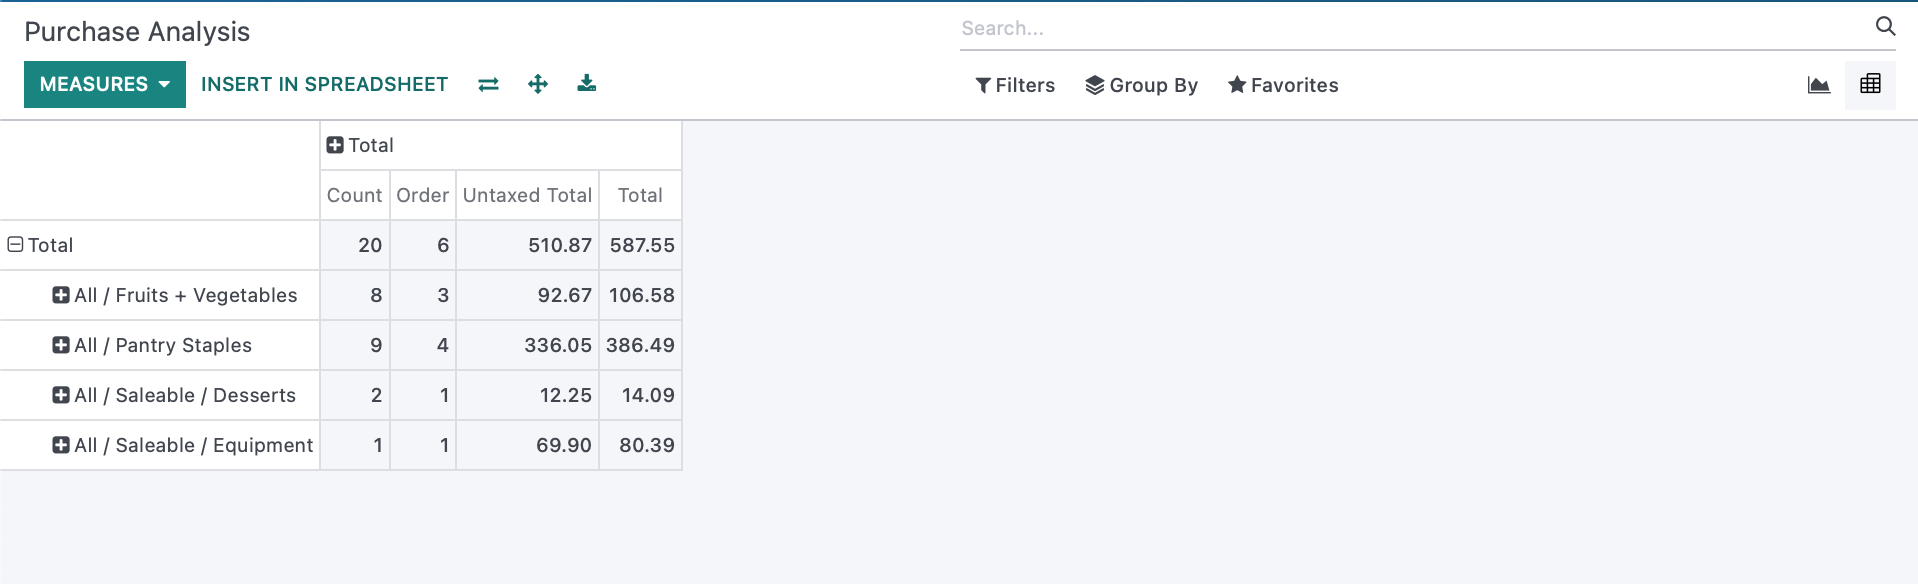
Pivot View
The second view of the report is presented as a pivot table and can be also be configured to your needs.
Measures: Modify the data included in your recordset.
- INSERT IN SPREADSHEET: This will allow you to export the data into a spreadsheet in Odoo. To learn more about this, please review our Spreadsheets documentation.
Flip Axis: Switch the positions of your X and Y axes.
Expand: Expands data that is expandable.
Download xls: Allows you to download the data in your pivot table to an xls spreadsheet format.
Good to Know
Odoo makes customizing pivot tables so easy. Within any pivot table, use the and icons on the table, itself, to add or remove specific data. Be sure to save your report for later use.