Repairs: Reporting
Purpose
This document covers the views that can be used for reporting within the Repairs application in Odoo 16.
Process
To get started, navigate to the Repairs app.
Default Filters
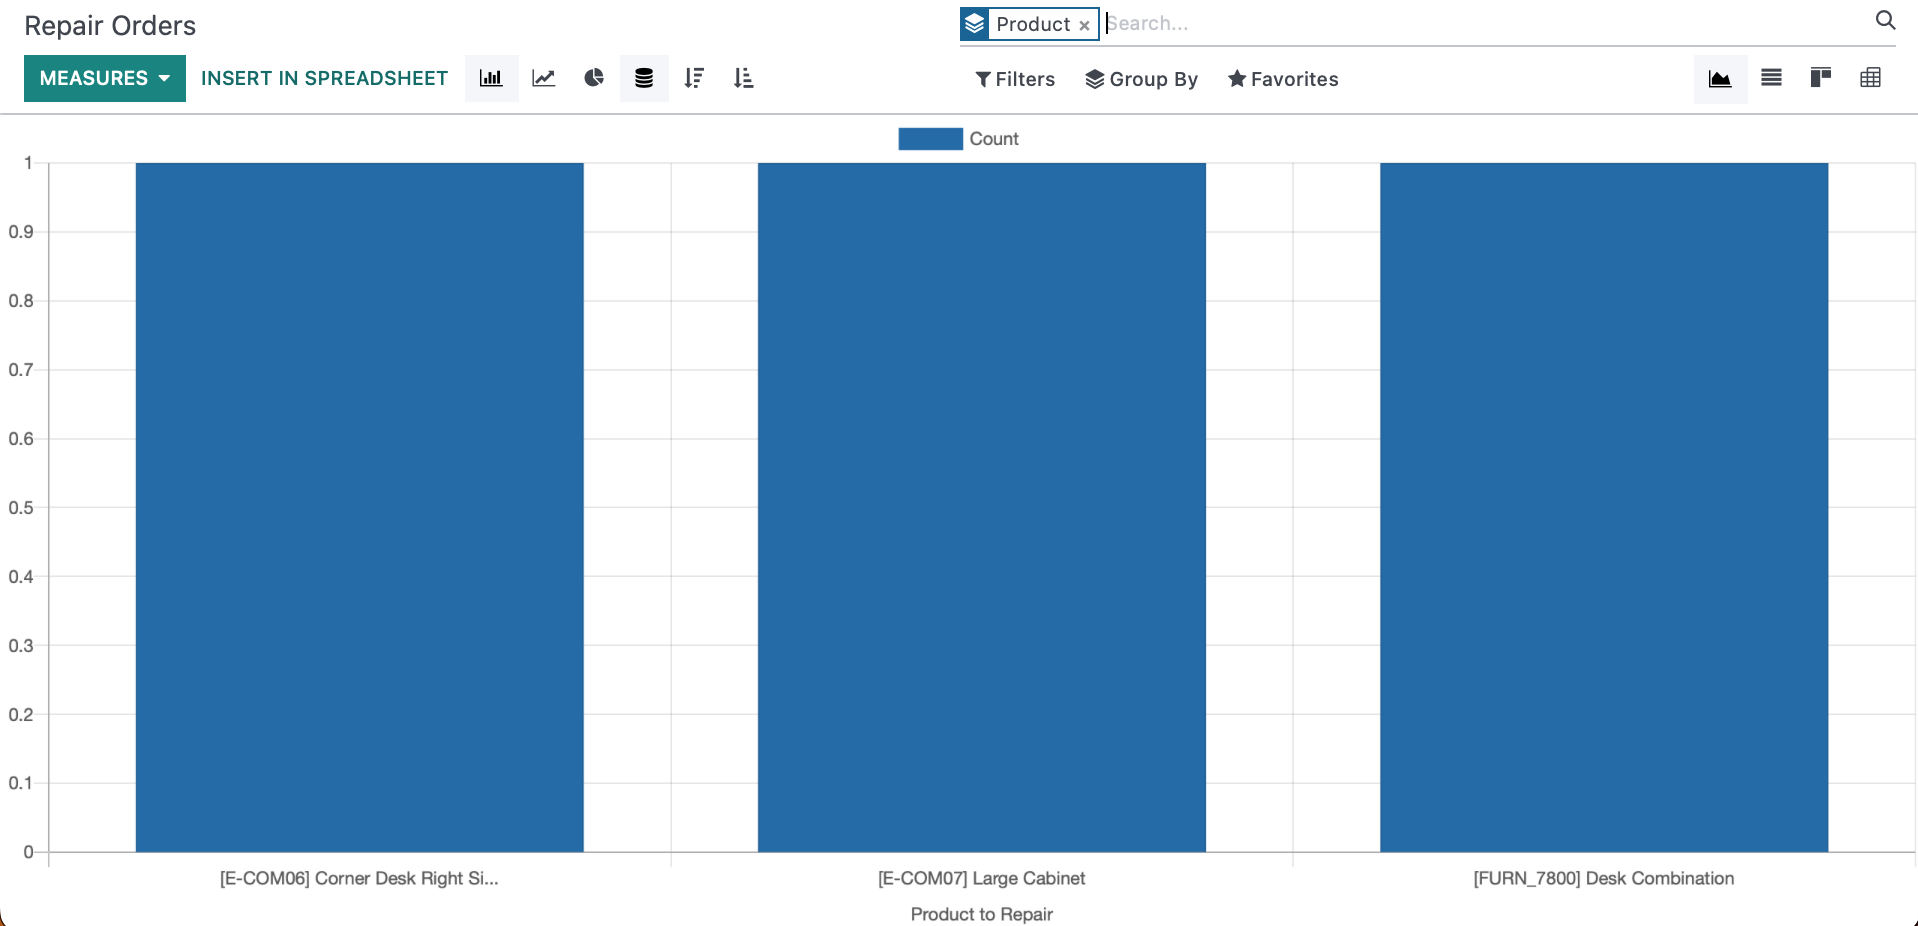
When you first open this reporting page, your default view will group this report by the Product. You can clear these filters by clicking the
Tailor Report Views
Nested under the search bar are options to tailor your view. If you don't see these options, click on the Caret to the left of the filter option to expand it.
Filter Options
You'll see following filter menus that will assist in creating tailored report views:
- Under the Filters dropdown, the following preset filters are available for this report: Quotations, Confirmed, Ready to Repair, and Returned. Select any options needed to narrow down the data.
- Use the Group By dropdown to so a list of presets groups or create a custom one.
- Use the Favorites dropdown to save and access custom record sets you'll use often

View Options
To the the right above the report, you will see different types of views to organize your data into.

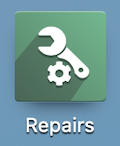
Graph View
The Graph view is your default view and will give a full-scope view of the data you've selected. The first section can be further configured to display your data in several different ways:
- Measures: Modify the data included in your recordset. The selected measures for the report shown above are displayed at the bottom of the chart (Total Purchased, UntaxedTotal, Orders, Average Order).
- INSERT IN SPREADSHEET: This will allow you to export the data into a spreadsheet in Odoo. To learn more about this, please review our Spreadsheets documentation.
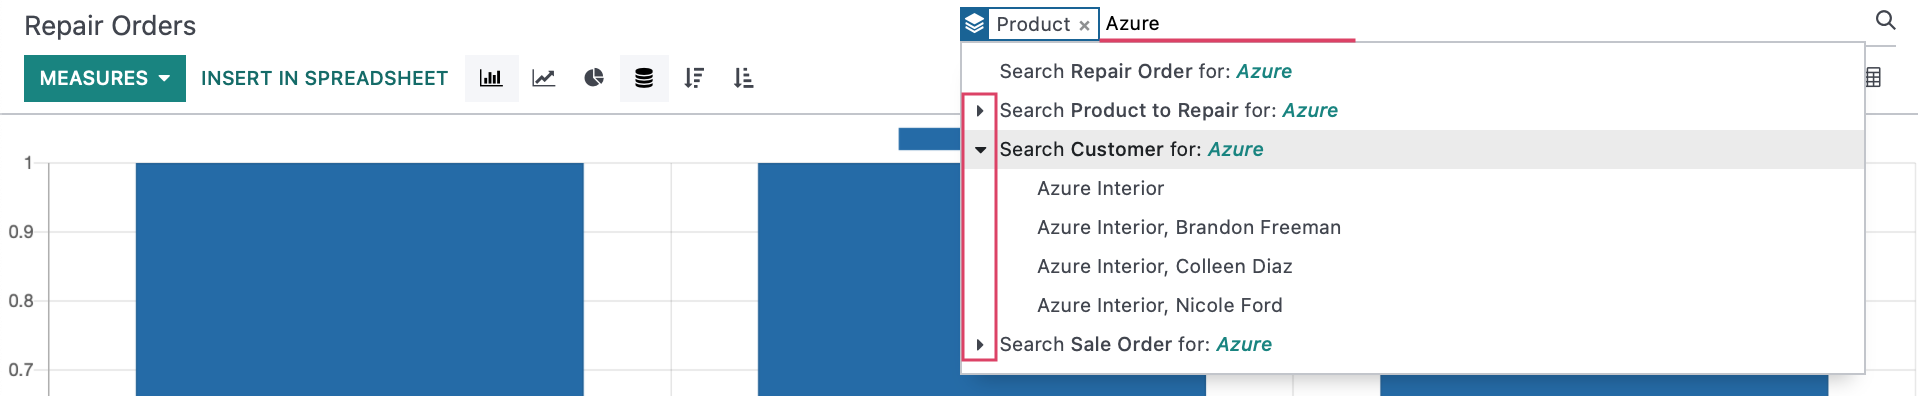
Bar Chart: This displays you data in a bar chart.
- This type of chart allows you to utilize the Stacked feature or organize the data by Descending or Ascending.
Line Chart: This displays your data in a line chart.
- This type of chart allows you to utilize the Cumulative feature and organize the data by Descending or Ascending.
- This type of chart allows you to utilize the Cumulative feature and organize the data by Descending or Ascending.
Pie Chart: This displays your data in a pie chart.
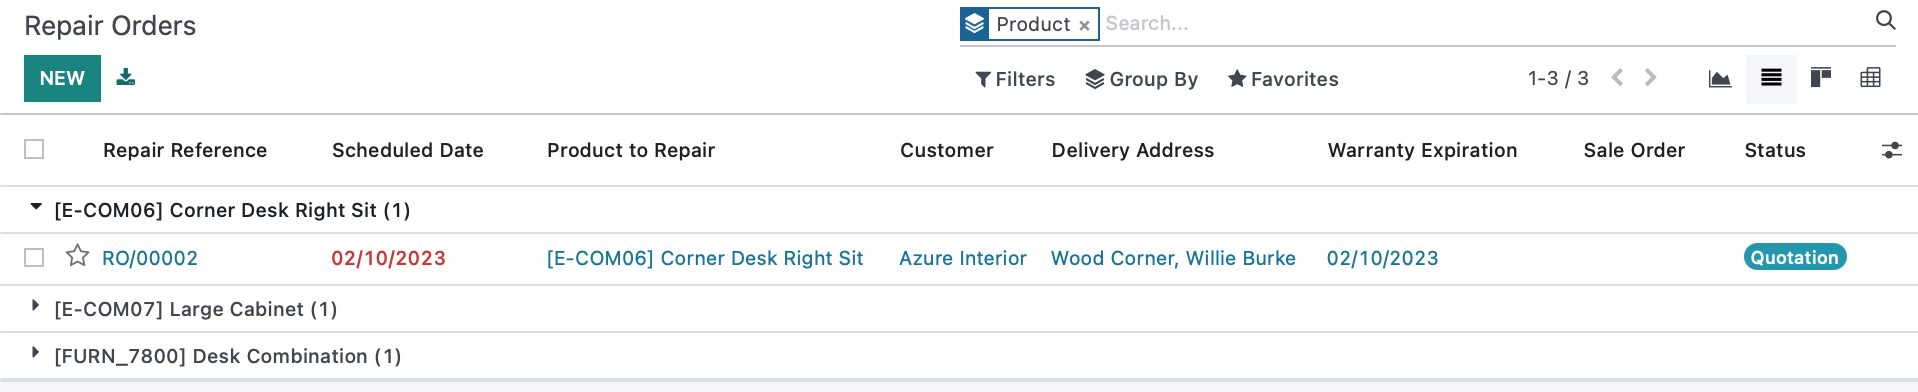
List View
Using List View will place all of your existing repairs in an easy to view list, displaying reference numbers, the product in need of repair, the customer and their delivery address, warranty expiration and the status of each repair. These fields can be toggled on or off, and you can add fields by clicking on the Sliders.
You can also NEW a new repair, or use the Export All button to convert this page into an easy to read spreadsheet.
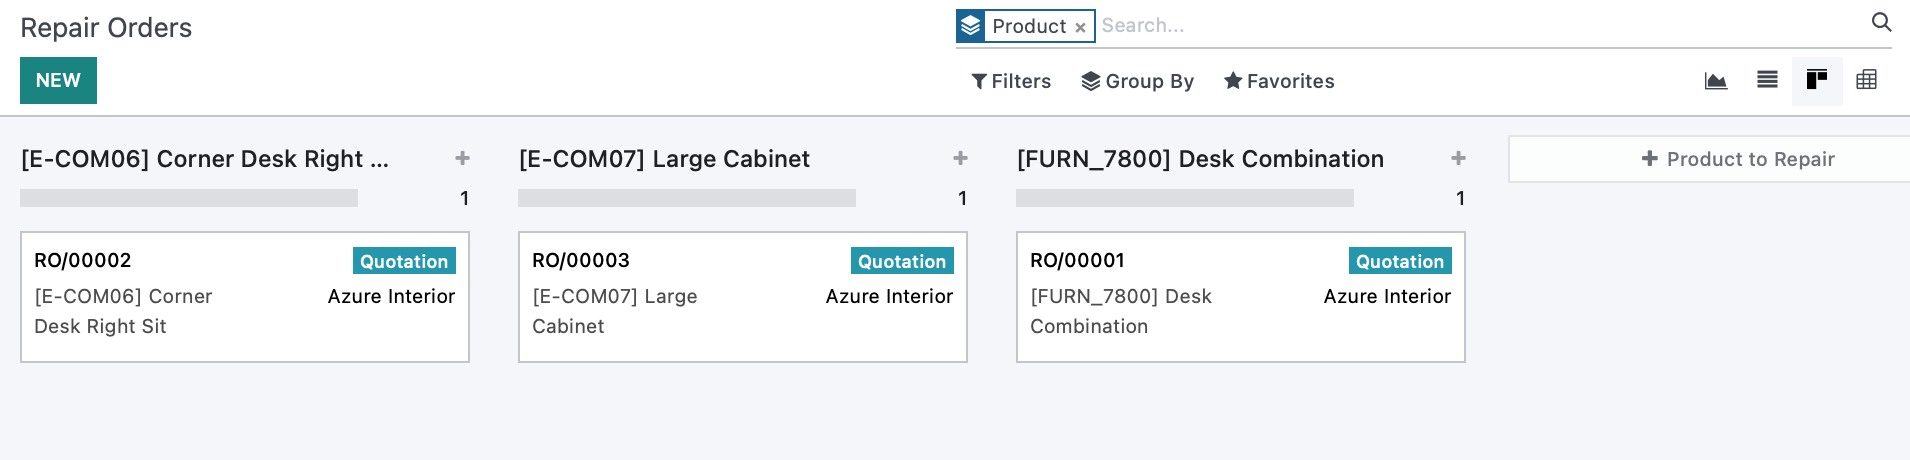
Kanban View
In Kanban view, all repairs for a single piece of equipment will be shown in separate columns. The information of each repair will be displayed on tiles that will show the piece of equipment it is for, the status of the repair, as well as who the repair is for.
From this screen, you can also NEW a new repair order.
Pivot View
In the Pivot View, data with will displayed with the information filling in a table
Measures: Modify the data included in your recordset.
- INSERT IN SPREADSHEET: This will allow you to export the data into a spreadsheet in Odoo. To learn more about this, please review our Spreadsheets documentation.
Flip Axis: Switch the positions of your X and Y axes.
Expand: Expands data that is expandable.
Download xls: Allows you to download the data in your pivot table to an xls spreadsheet format.

Good to Know!
Odoo makes customizing pivot tables very easy. Within any pivot table, use the and on the table to add or remove specific data. Be sure to save your report for later use.