Maintenance: Reporting
Purpose
This document covers the reporting options within the Maintenance application of Odoo 16.
Process
To get started, navigate to the Maintenance app.
Click on Reporting > Maintenance Requests.
Tailor Report Views
Nested under the search bar are options to tailor your view. If you don't see these options, click the Caret to the left of the filter option to expand it.
![]()
Filter Options
You'll see following filter menus that will assist in creating tailored report views:
- Under the Filters dropdown, the following preset filters are available for this report: My Maintenances, To Do, Blocked, Ready, High-Priority, and Unscheduled. Select any options needed to narrow down the data.
- Use the Group By dropdown to so a list of presets groups or create a custom one.
- Use the Favorites dropdown to save and access custom record sets you'll use often

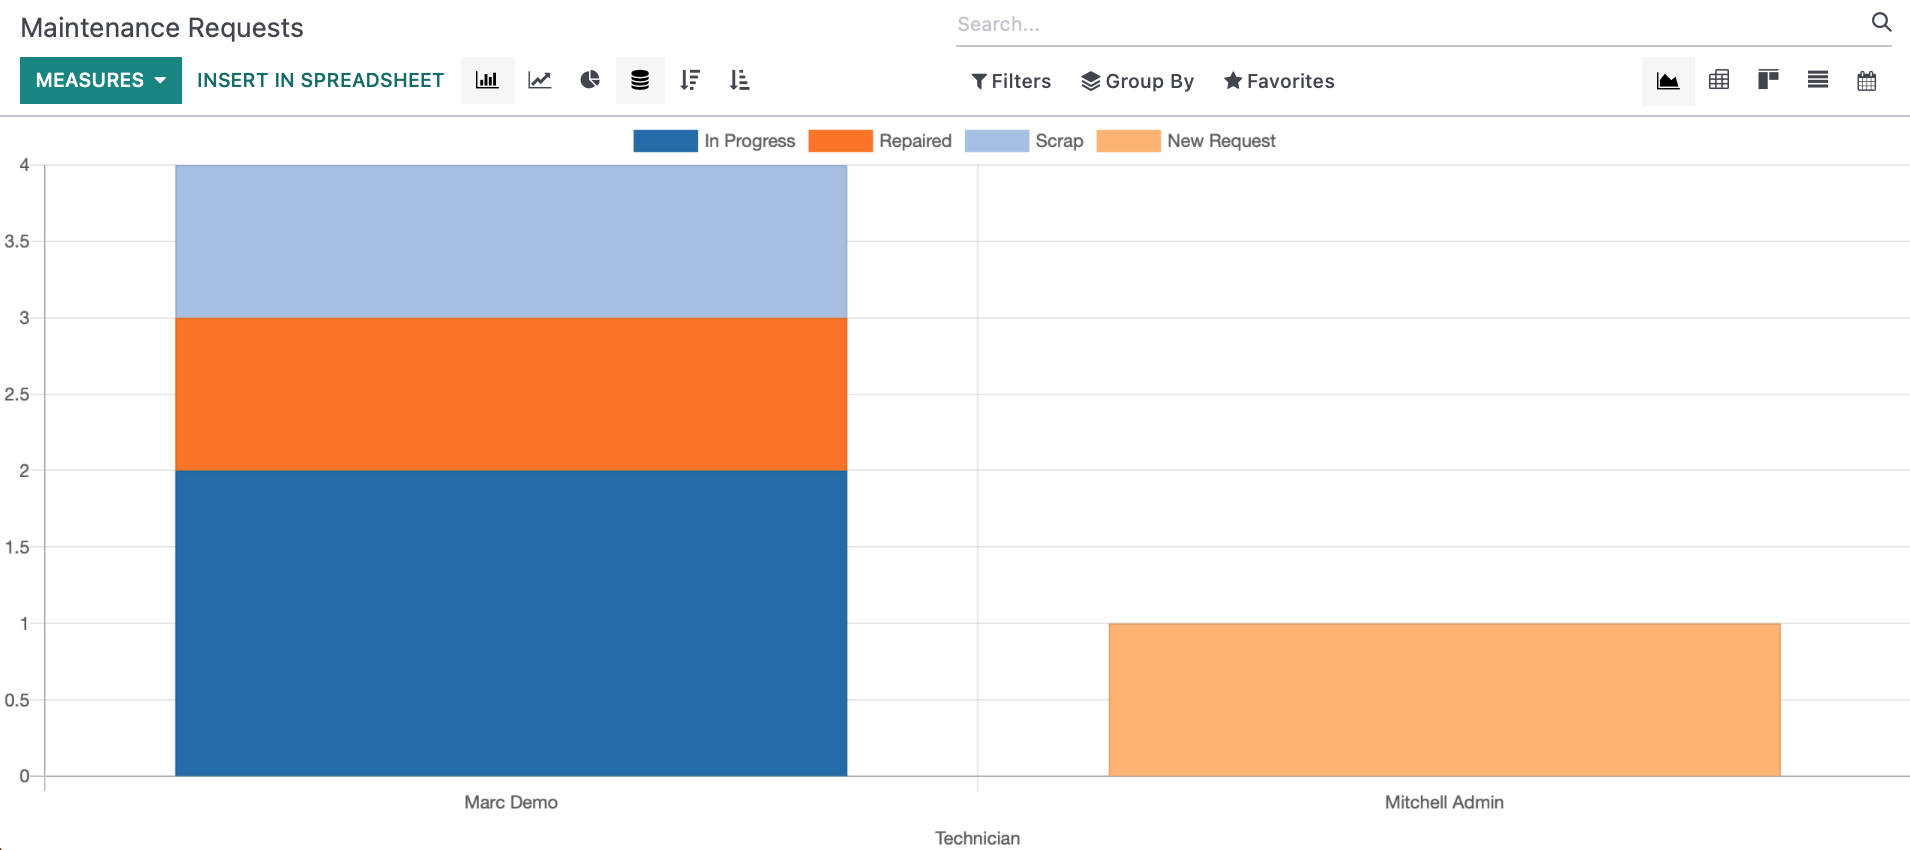
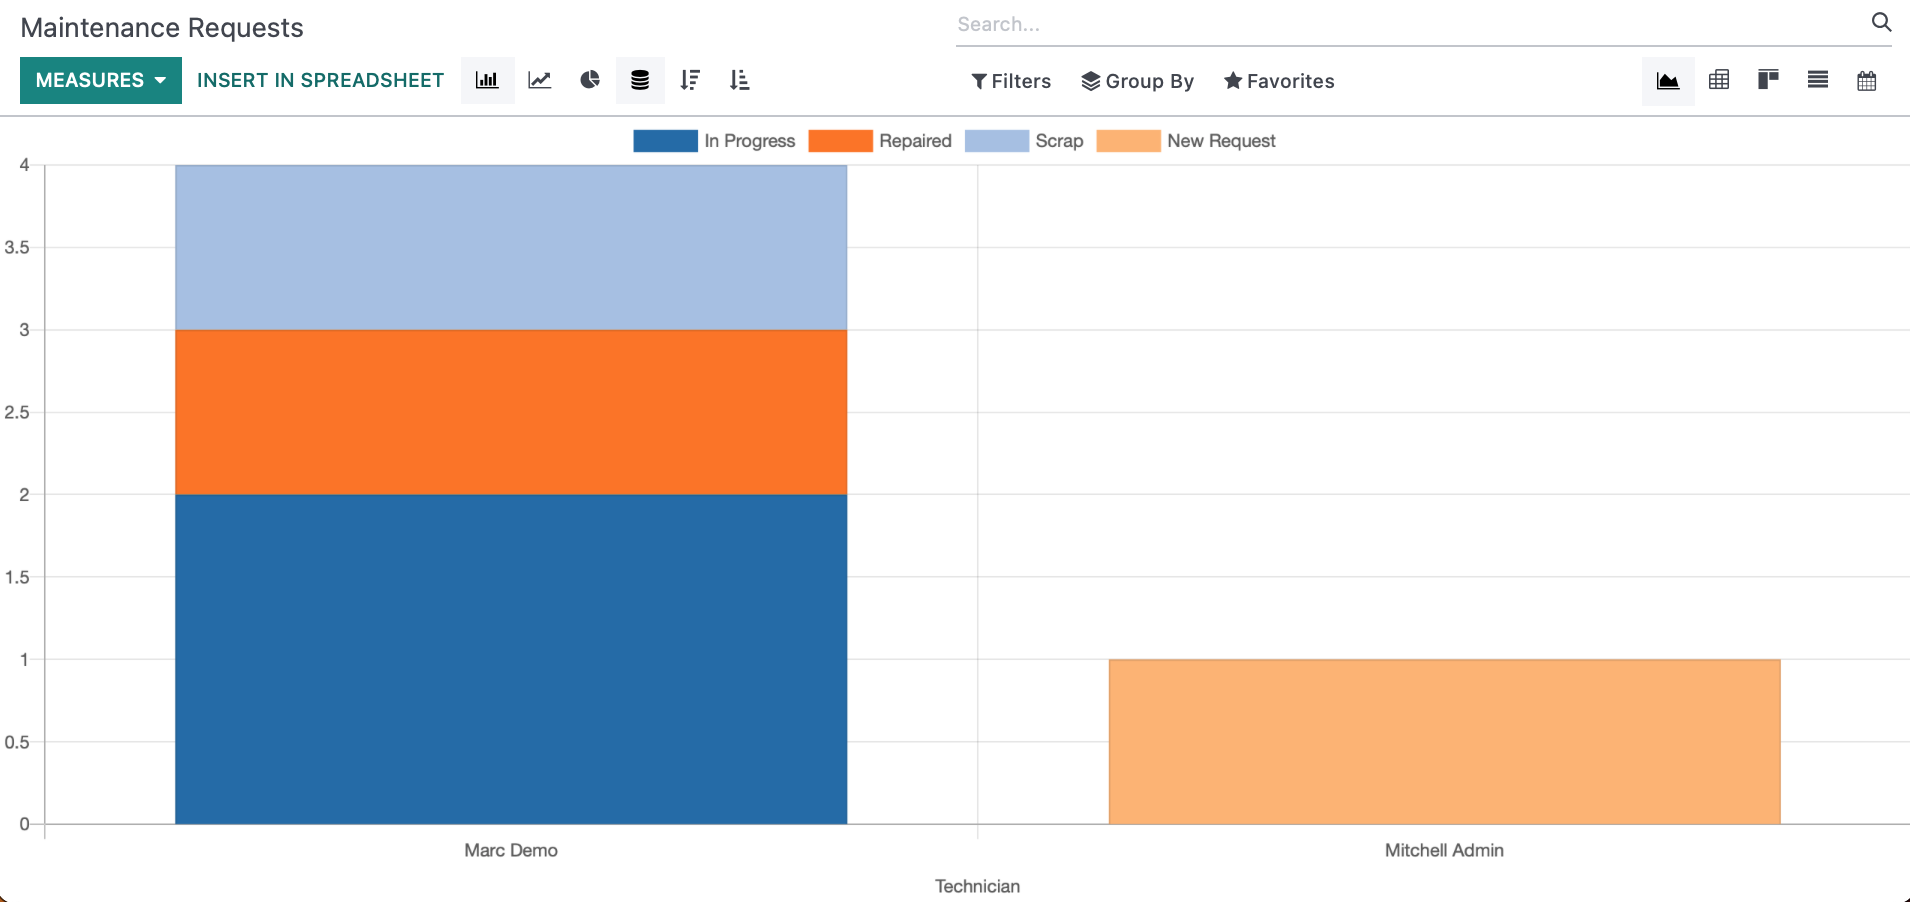
Graph View
The Graph view is your default view and will give a full-scope view of the data you've selected. The first section can be further configured to display your data in several different ways:
- Measures: Modify the data included in your recordset. The selected measures for the report shown above are displayed at the bottom of the chart (Total Purchased, UntaxedTotal, Orders, Average Order).
- INSERT IN SPREADSHEET: This will allow you to export the data into a spreadsheet in Odoo. To learn more about this, please review our Spreadsheets documentation.
Bar Chart: This displays you data in a bar chart.
- This type of chart allows you to utilize the Stacked feature or organize the data by Descending or Ascending.
Line Chart: This displays your data in a line chart.
- This type of chart allows you to utilize the Cumulative feature and organize the data by Descending or Ascending.
- This type of chart allows you to utilize the Cumulative feature and organize the data by Descending or Ascending.
Pie Chart: This displays your data in a pie chart.
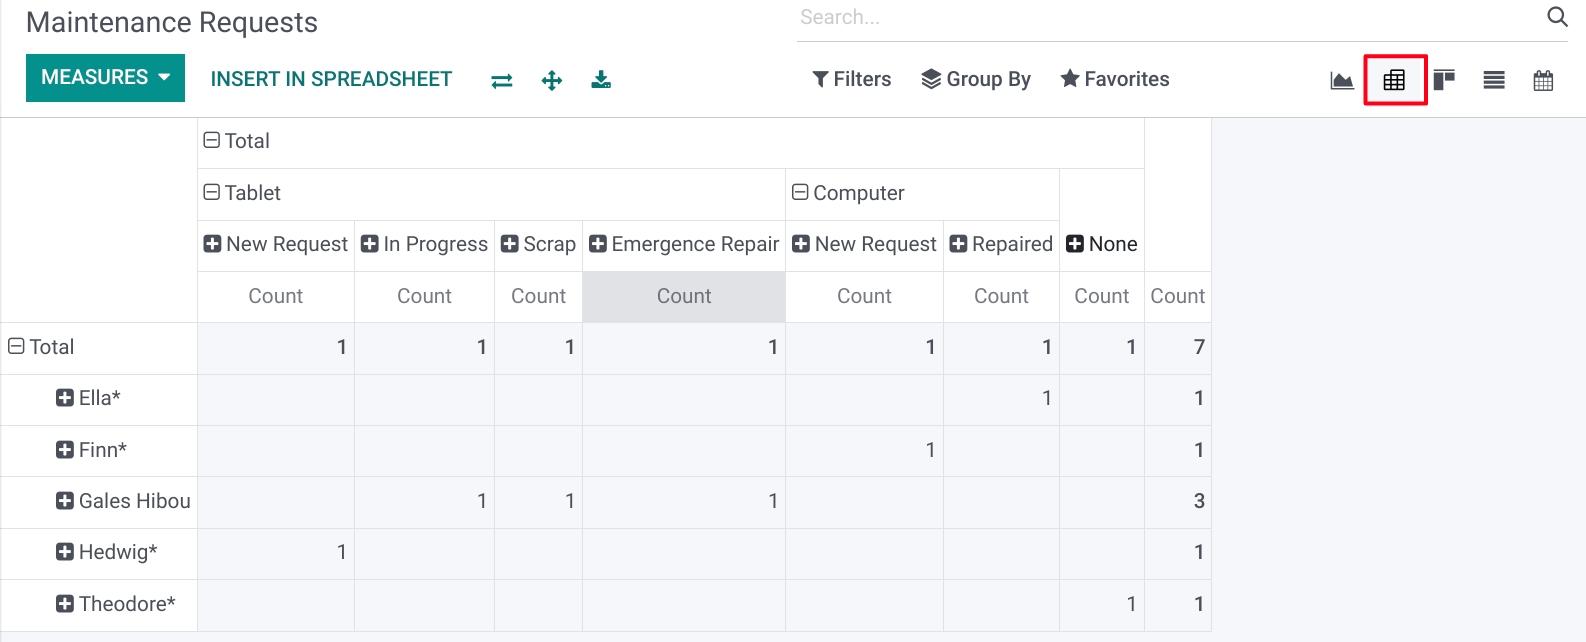
Pivot View
In the Pivot View, data with will displayed with the information filling in a table
Measures: Modify the data included in your recordset.
- INSERT IN SPREADSHEET: This will allow you to export the data into a spreadsheet in Odoo. To learn more about this, please review our Spreadsheets documentation.
Flip Axis: Switch the positions of your X and Y axes.
Expand: Expands data that is expandable.
Download xls: Allows you to download the data in your pivot table to an xls spreadsheet format.
Kanban View
Using the Kanban view, all of your maintenance requests will be laid out in your pipeline, showing all of the stages defined by your company.
The information of each request will be displayed on tiles that will show a description of the request, the piece of equipment it is for, the category of the equipment, who the request is assigned to, and the request's priority level.
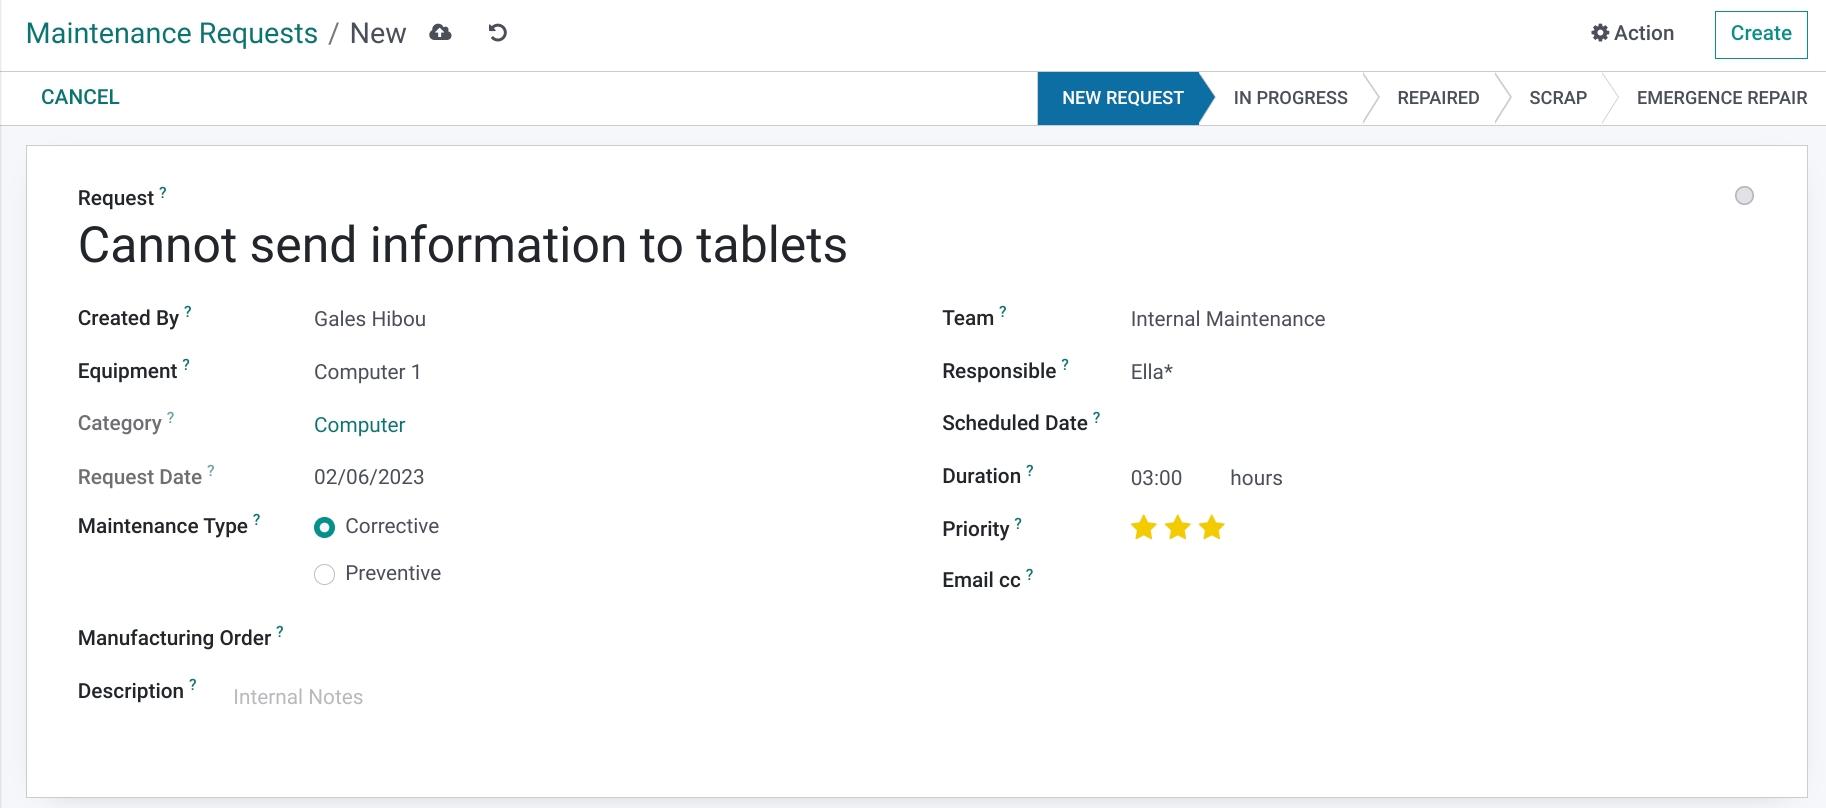
From this screen, you can also click NEW to create a maintenance request.
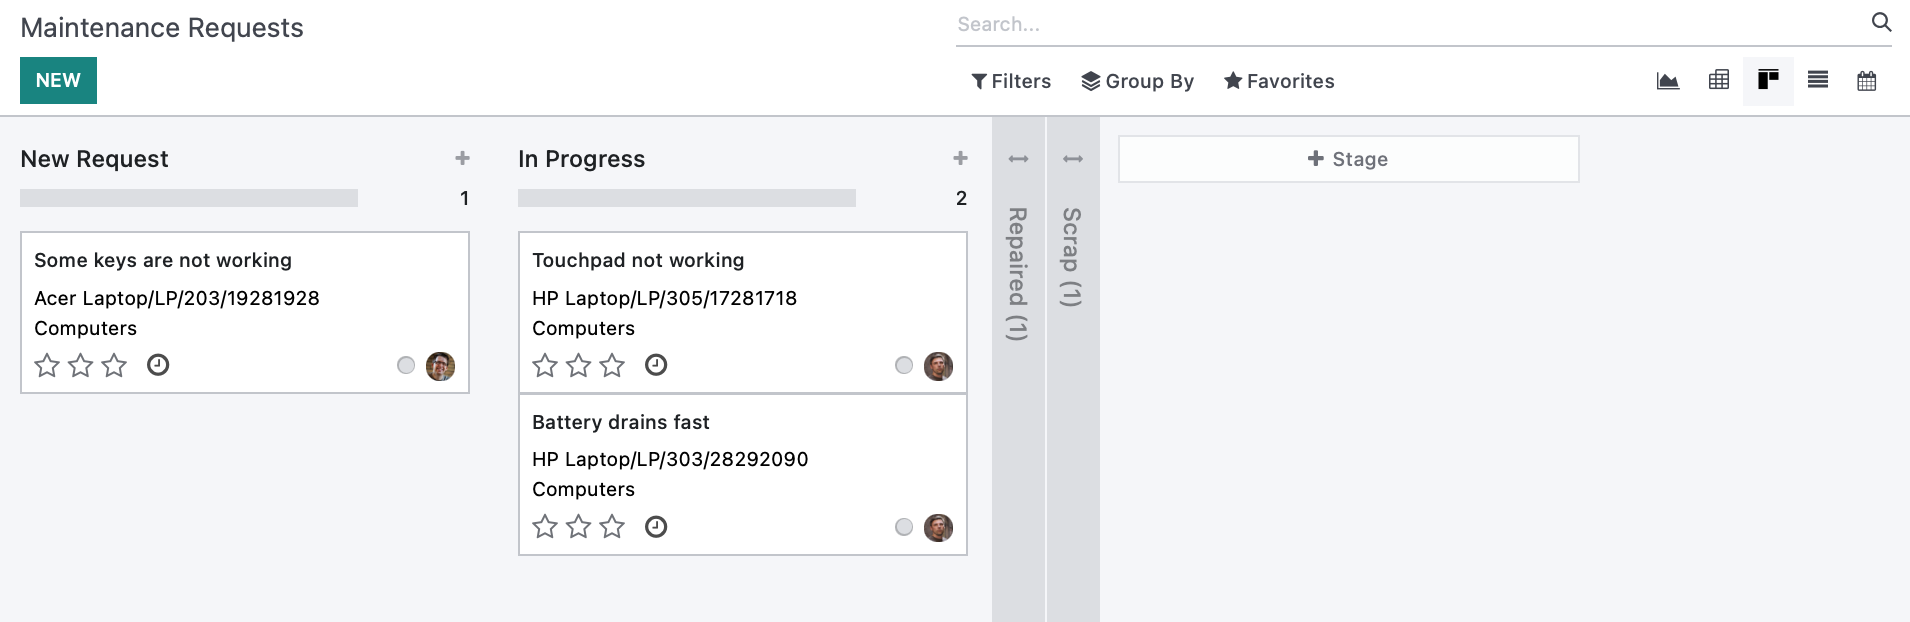
If you need further documentation on creating a maintenance request, or for descriptions of the fields shown below, see Maintenance Requests + Calendar for help.
List View
Using this view will place all of your existing maintenance requests in an easy to view list, displaying important information: Employee that created the request, the Technician assigned, the category that the piece of equipment belongs to, as well as the stage it is in in your pipeline.
You are able to click any of the Subjects to open the request template, click NEW a new request, or you can use the Export All button to convert this page into an easy to read spreadsheet. 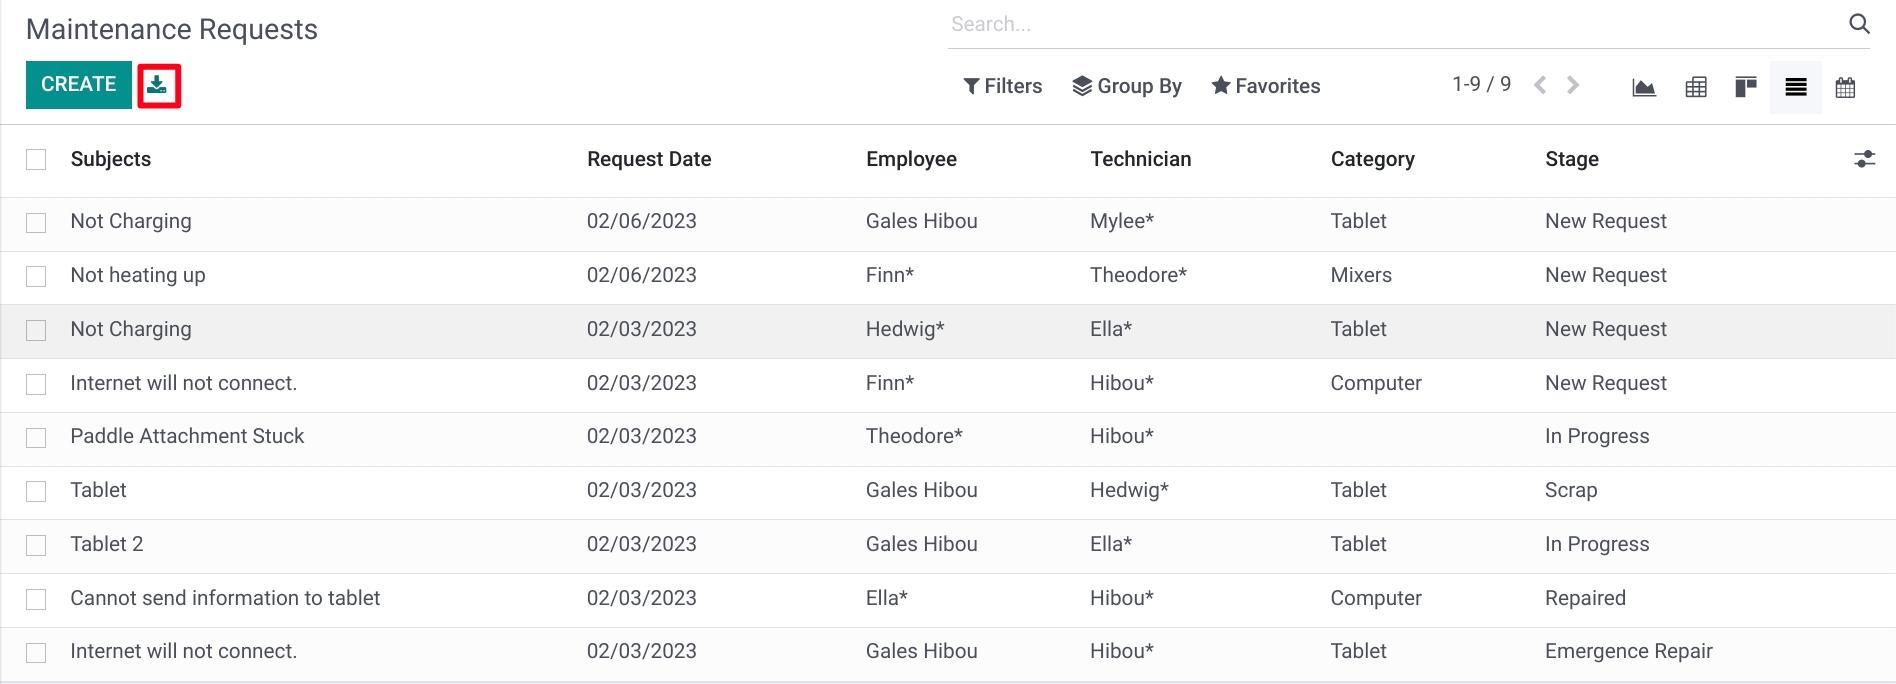
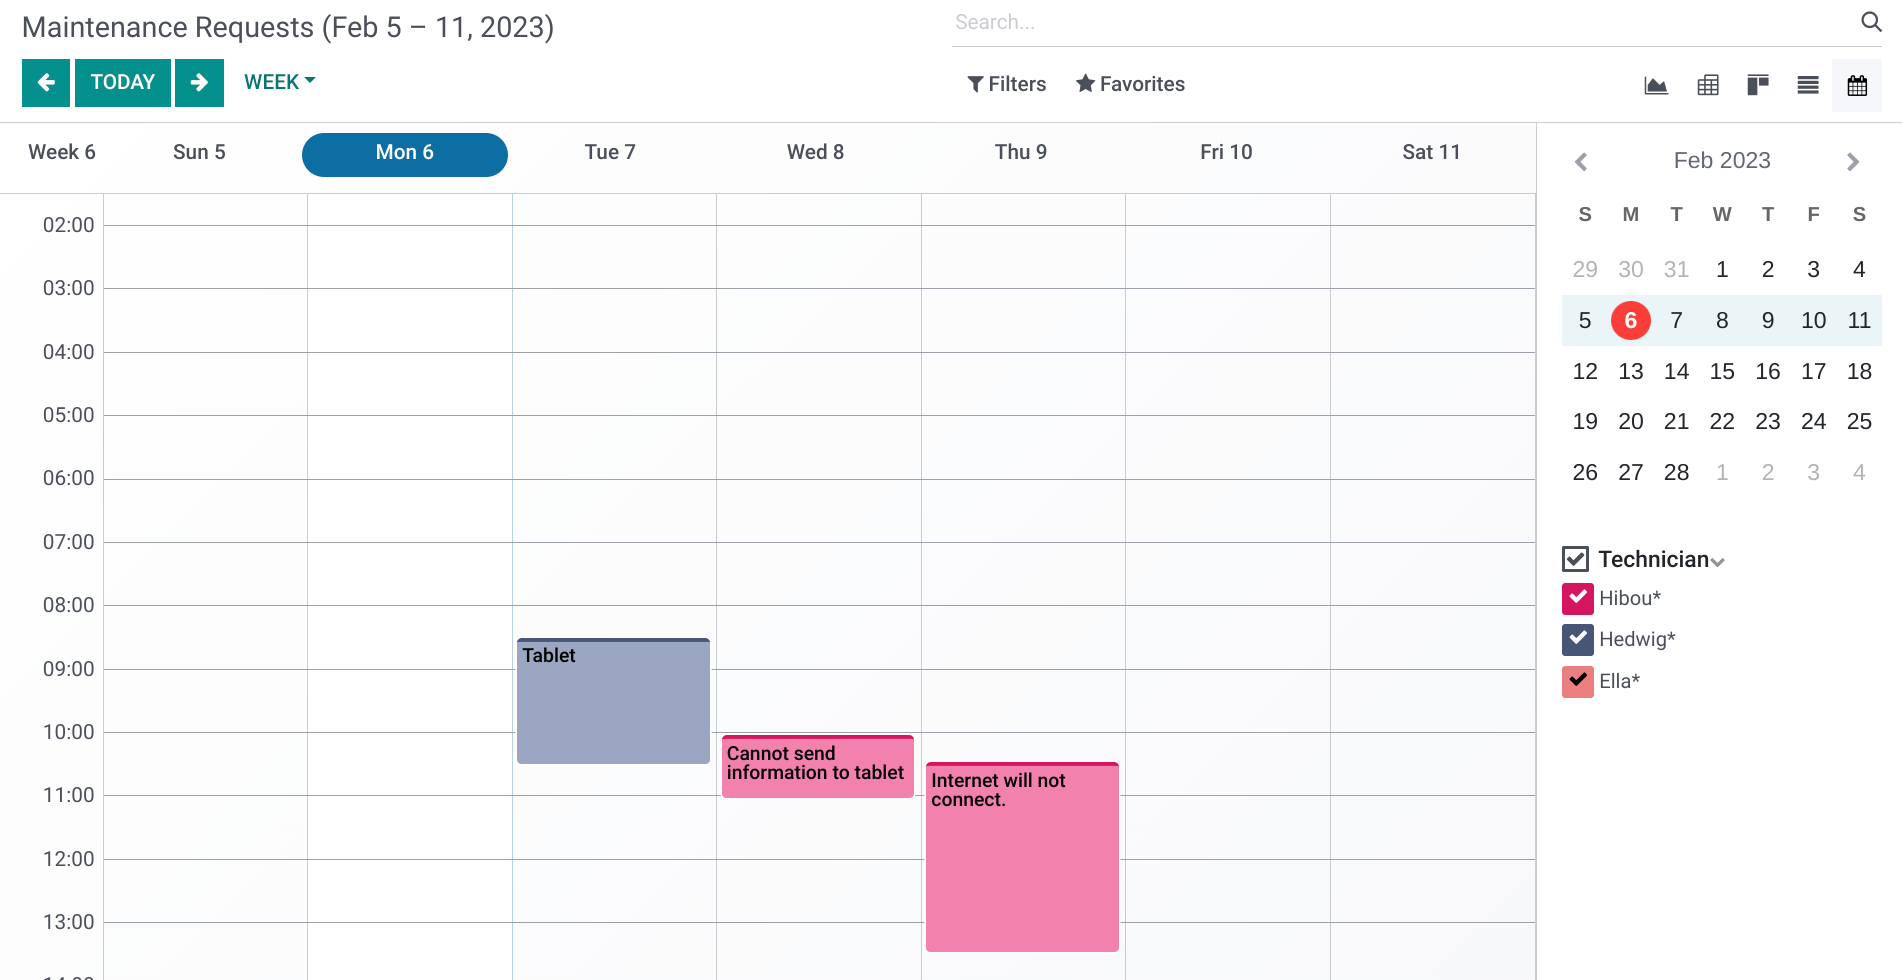
Calendar View
This is the last view option in the maintenance app. This will show you all of your scheduled requests, on the date and time that they are to be worked on.
Clicking on any of the scheduled requests will bring you to the request template, where you can then make any changes that may be required.
Note: When view the current week, the current day's column will be highlighted and there will be a red line showing the current time of day.