Repairs: Reporting
Purpose
This document covers the views that can be used for reporting within the Repairs application in Odoo 15.
Process
To get started, navigate to the Repairs app.
There are many ways to view the repair history, but by default the information will be presented in the Stacked - Graph View, so we will begin there.
Graph View
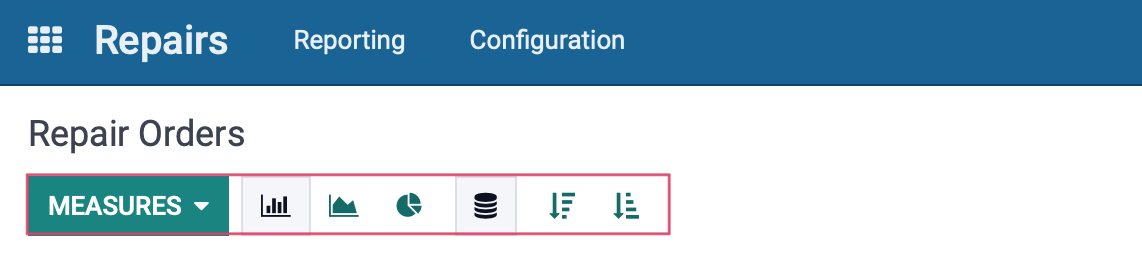
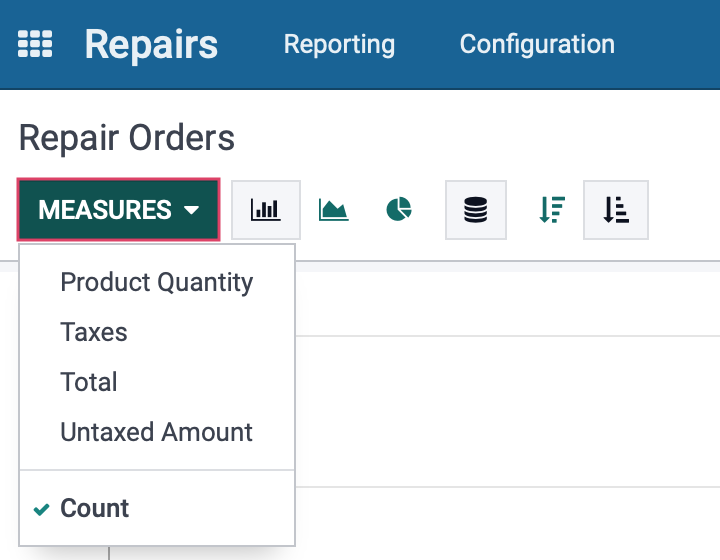
Start by clicking on Measure; you will see that the Count measurement is selected by default, and you will also be looking at the Bar Chart. You can select any of these measures you like, but only one may be active at a time. The measures will define the parameters for the X and Y axis.
The Stacked is only applicable in Graph View and combines data into a single column (e.g. per piece of equipment). If Stacked was not selected, a single piece of equipment that has had 3 repairs would display as 3 separate columns side by side. Also note, that in Graph View, the information can be displayed in Descending or Ascending Order.
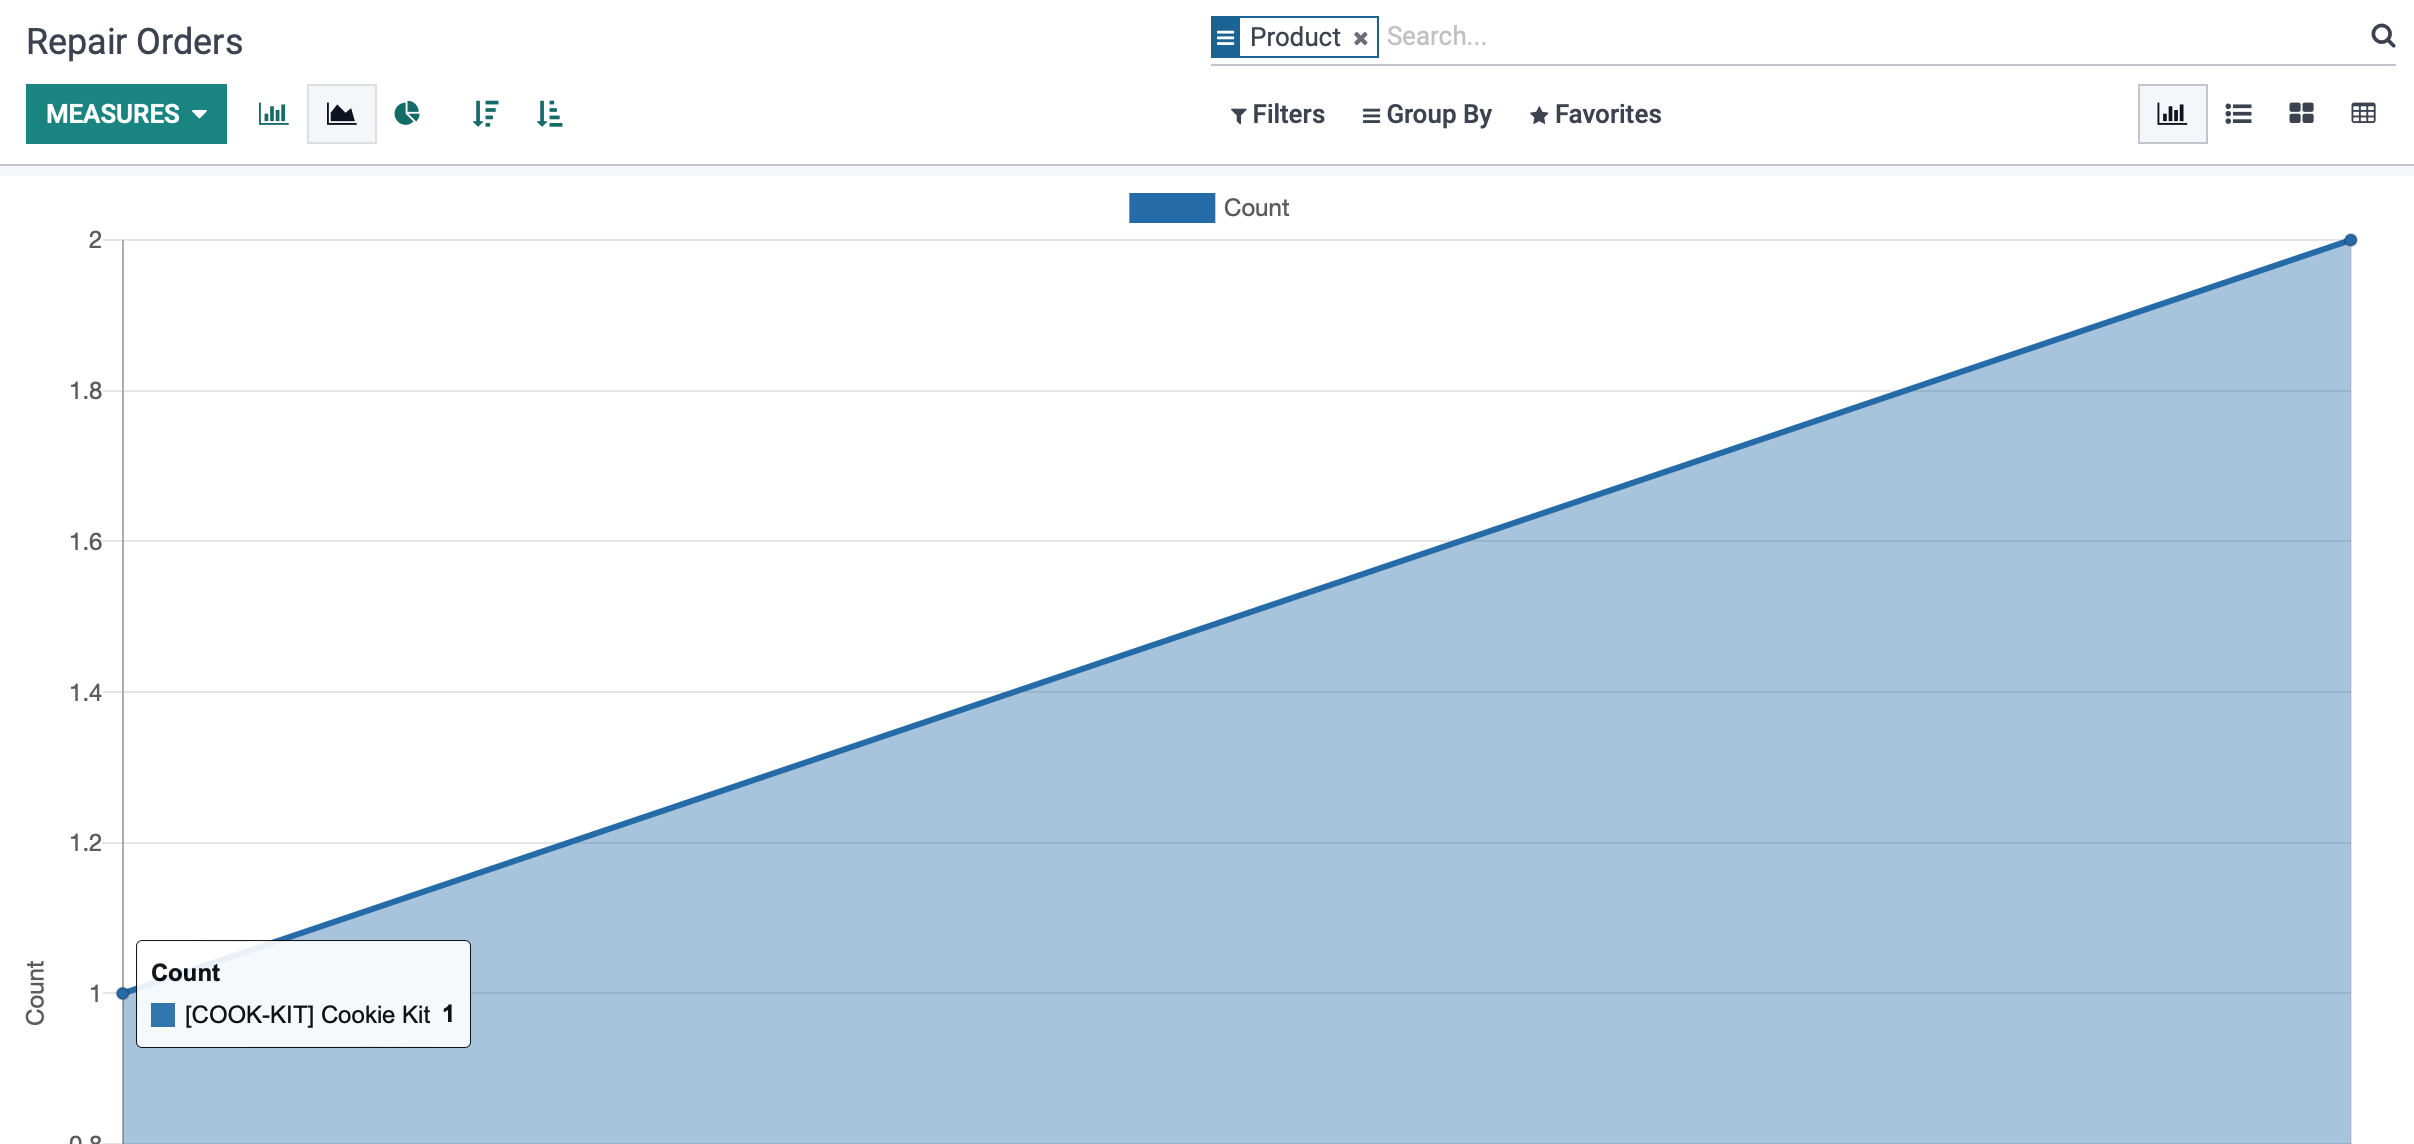
Line Chart: This will use the same X and Y axis designations as the Bar Chart, but will instead be displayed by lines as opposed to bars. Note that this chart can be displayed in either Descending or Ascending order.
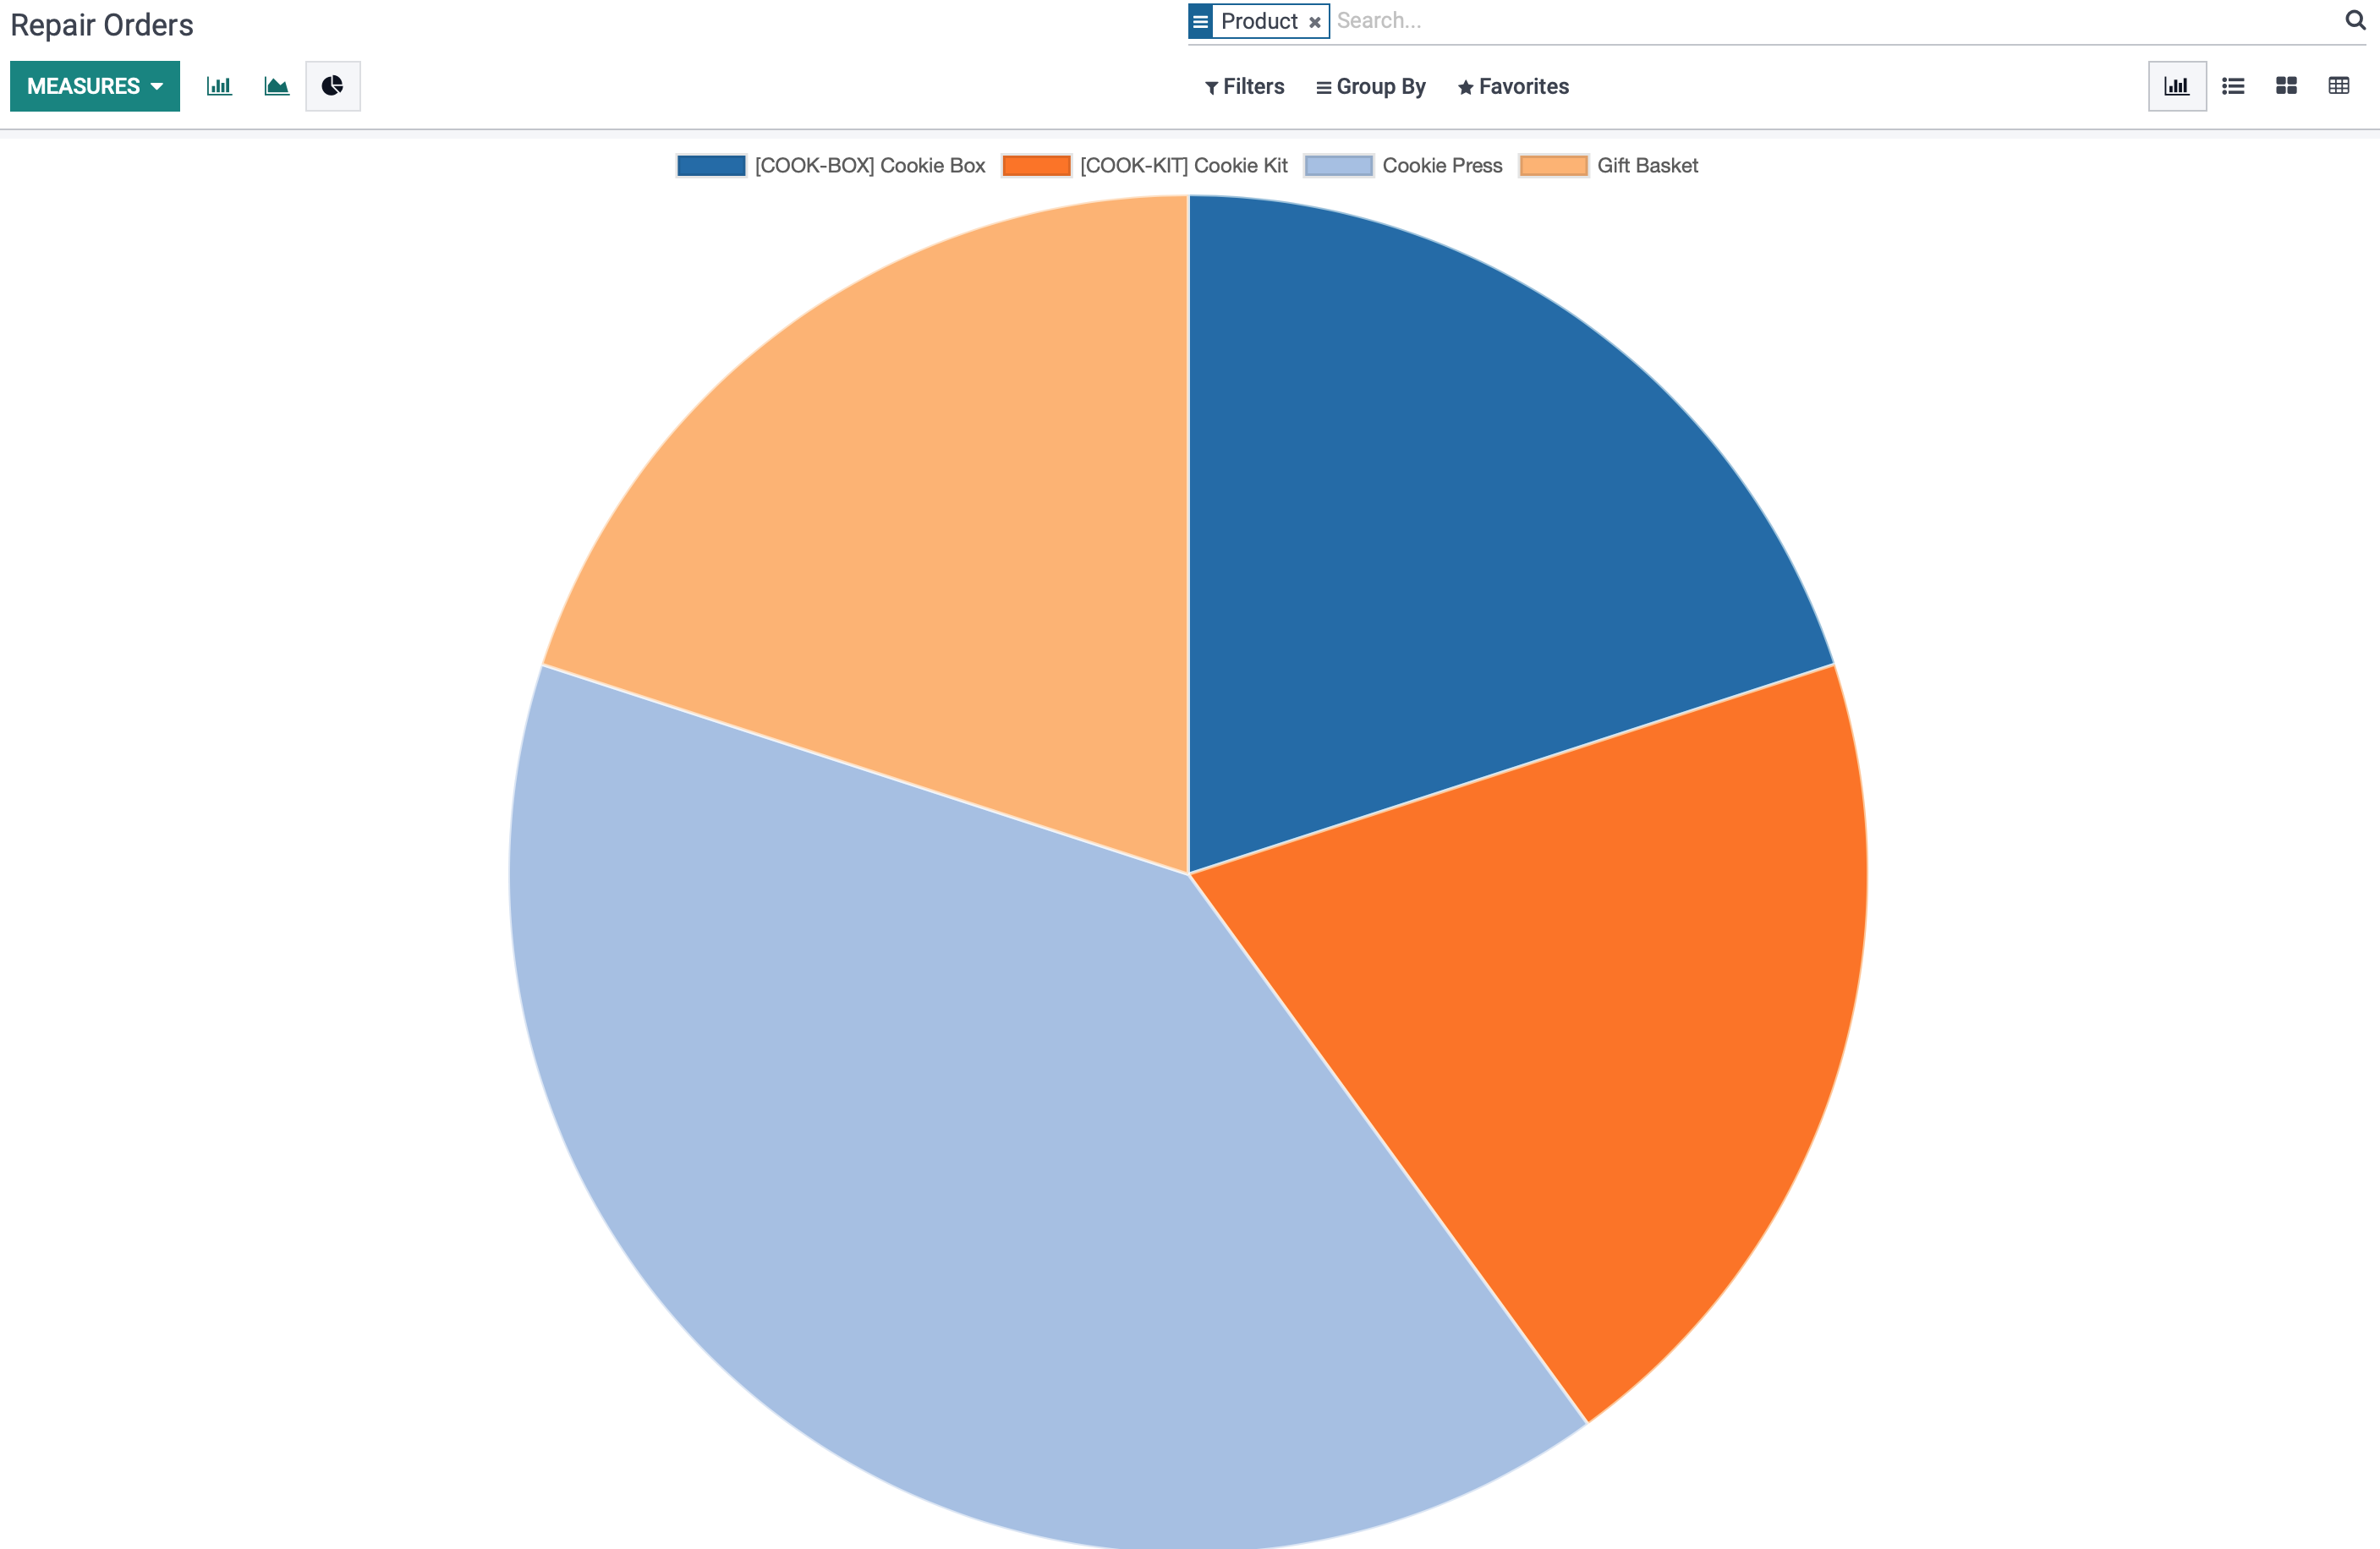
Pie Chart: This view separates the repair orders in "slices" with each slice being designated by the key located above the chart itself. When hovering over each slice, the count of repairs for each technician can be viewed.
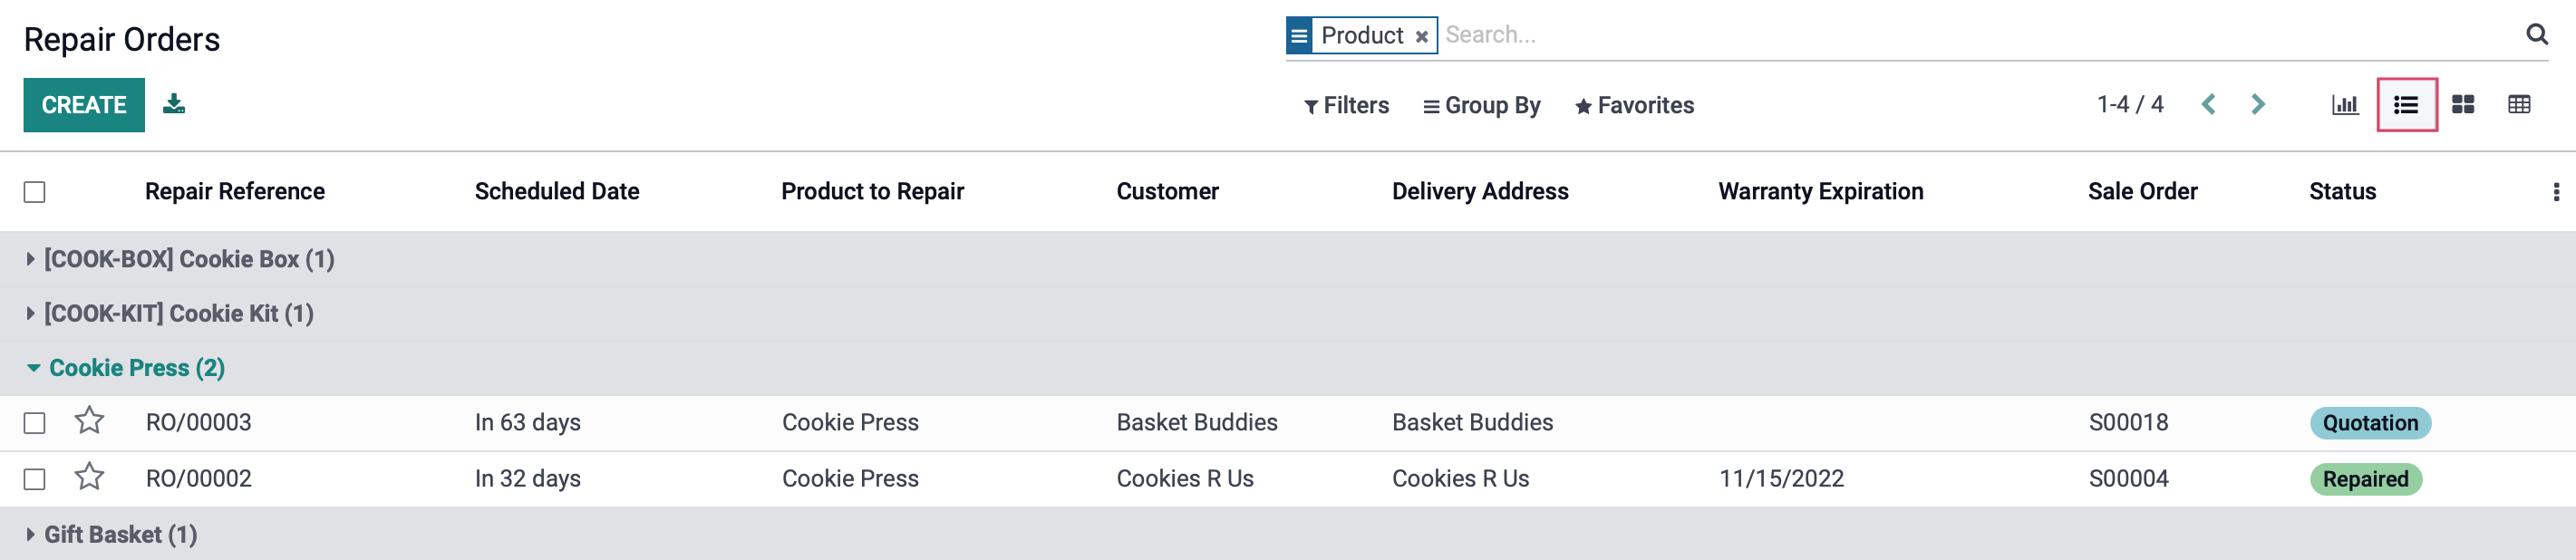
List View
Using List View will place all of your existing repairs in an easy to view list, displaying reference numbers, the product in need of repair, the customer and their delivery address, warranty expiration and the status of each repair. These fields can be toggled on or off, and you can add fields by clicking on the Ellipses.
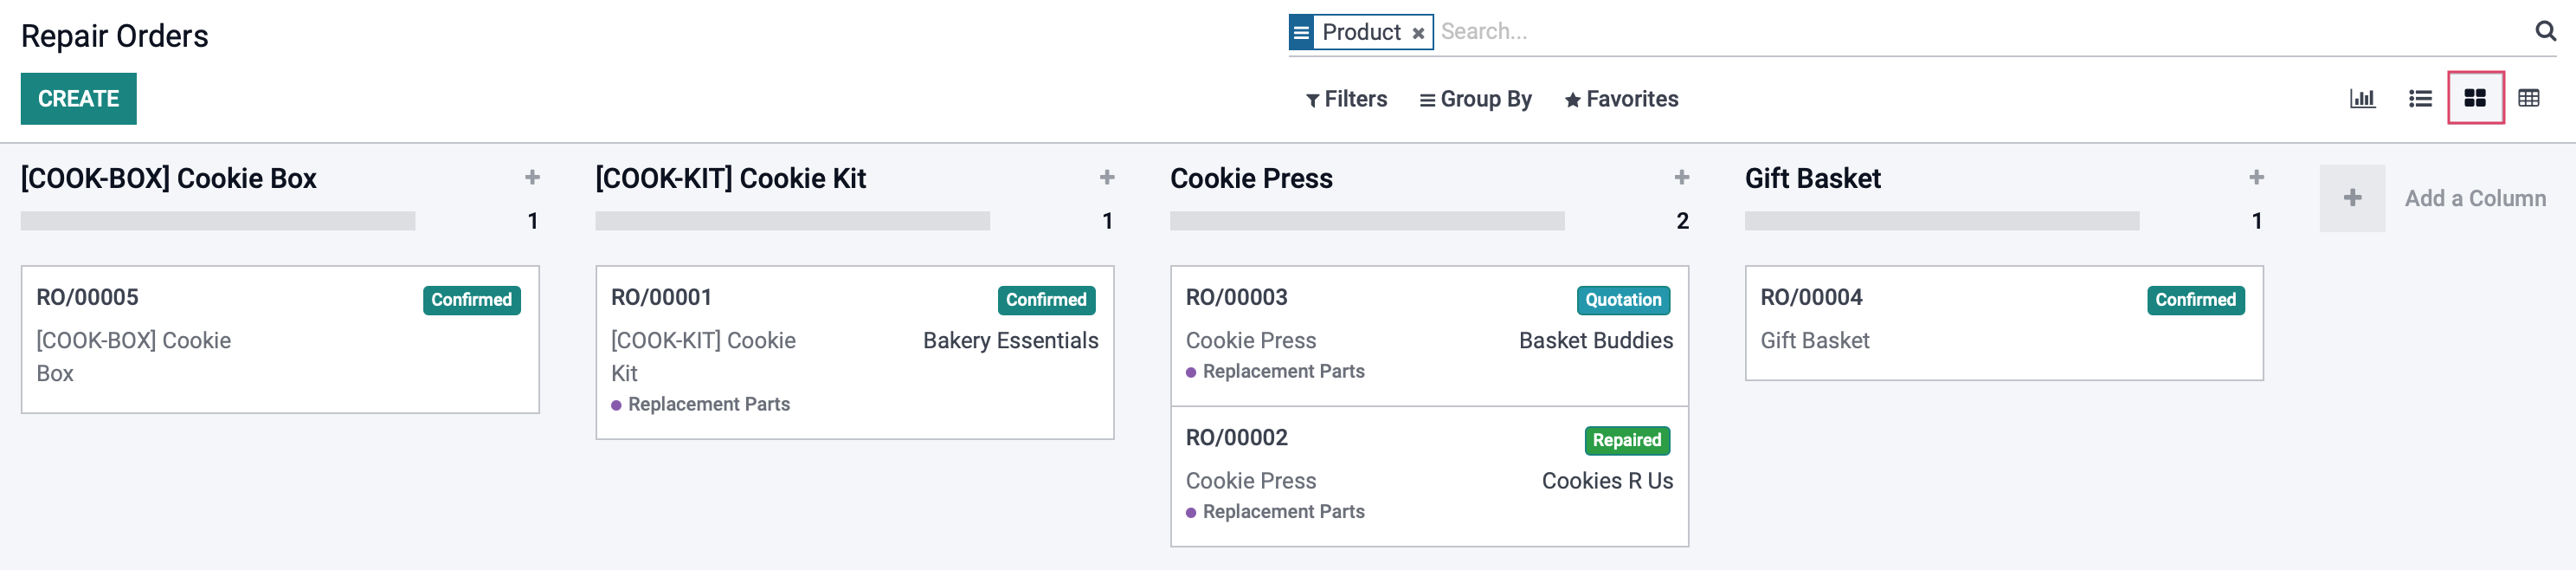
You are able to click any of the lines to open the RMA template. You can also CREATE a new repair, or use the Export All button to convert this page into an easy to read spreadsheet.Kanban View
In Kanban View, all repairs for a single piece of equipment will be shown in separate columns. The information of each repair will be displayed on tiles that will show the RMA reference, the piece of equipment it is for, the status of the repair, as well as who the repair is for. From this screen, you can also CREATE a new repair order.
Pivot View
In the Pivot View, data with will displayed with the information filling in a table. As with the other views, MEASURES can be defined as needed.
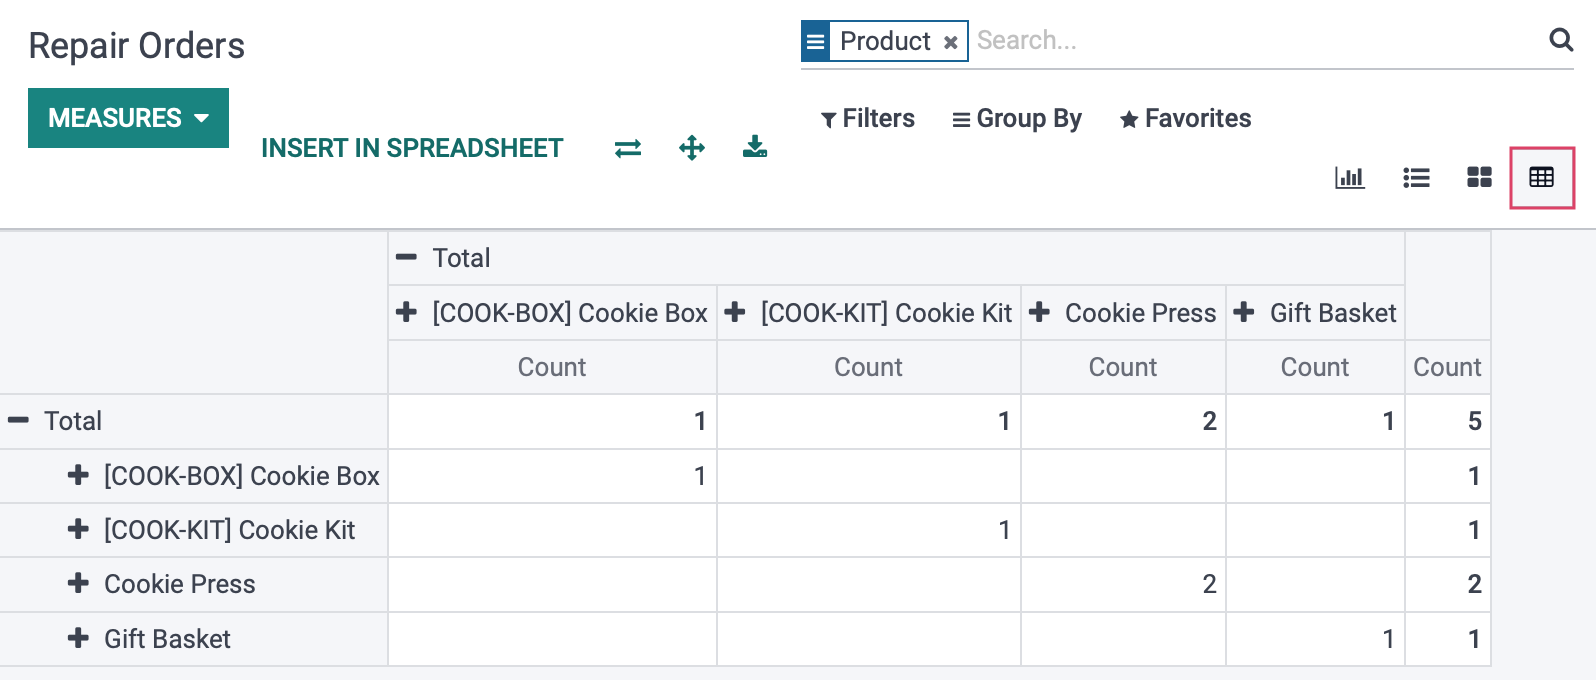
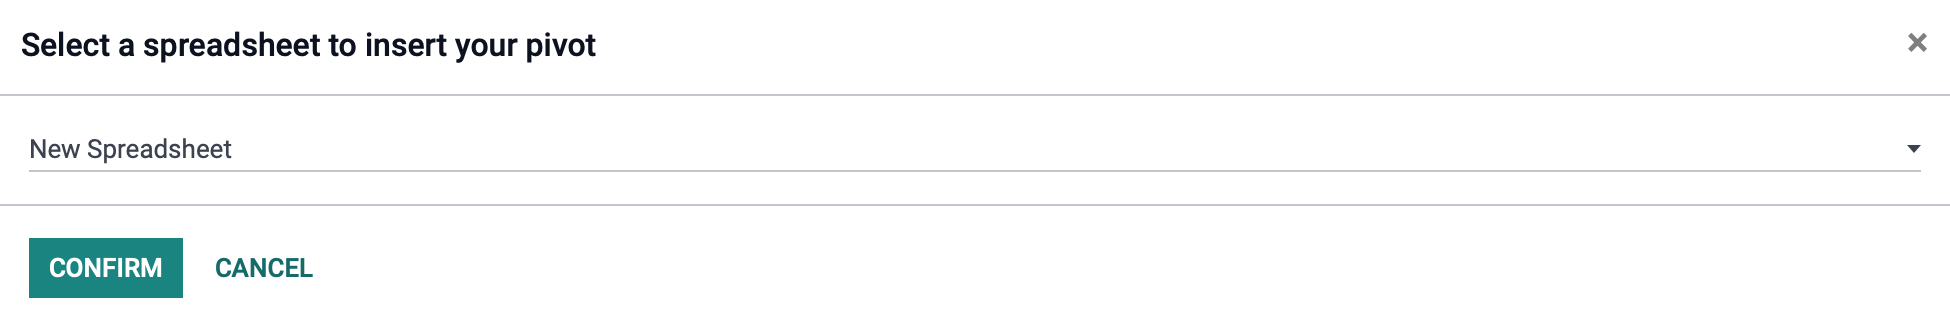
Clicking INSERT IN SPREADSHEET will bring up a modal allowing you to choose a spreadsheet to, you guessed it, insert into your view. For more information, see our Spreadsheets documentation. Click CONFIRM when ready.
Clicking on the or Total will display a drop-down menu with options to set as your X and Y axis data.
Flip Axis: Clicking this button will swap the information chosen for the X and Y axis.
Expand All: Clicking this button will expose all nested information for each item along it's axis.
Download xlsx: Clicking this button will send a downloaded file of this table for use outside of Odoo, which can be viewed in other applications or attached in emails, etc.