Subscriptions: Reporting
Purpose
This document covers the reporting functions of the Subscriptions application in Odoo 16.
Process
To get started, navigate to the Subscriptions app.
Subscriptions Analysis
Begin by clicking REPORTING > SUBSCRIPTIONS. This brings you to a screen, like the following image, showing you the amount of revenue per subscription type sorted by salesperson. Monthly Recurring Revenue is the default measure and can be changed as described below.
Pivot View
By default, this report opens up in the pivot view. On the left, the MEASURES button will let you populate the table with selectable options in the drop down.
You will also have the following options:
Flip Axis: This will flip the data displayed on the X and Y axis.
Expand All: This will expand any field with an icon to reveal any nested information.
Download xlsx: This will allow you to download the displayed information into an .xlsx file.
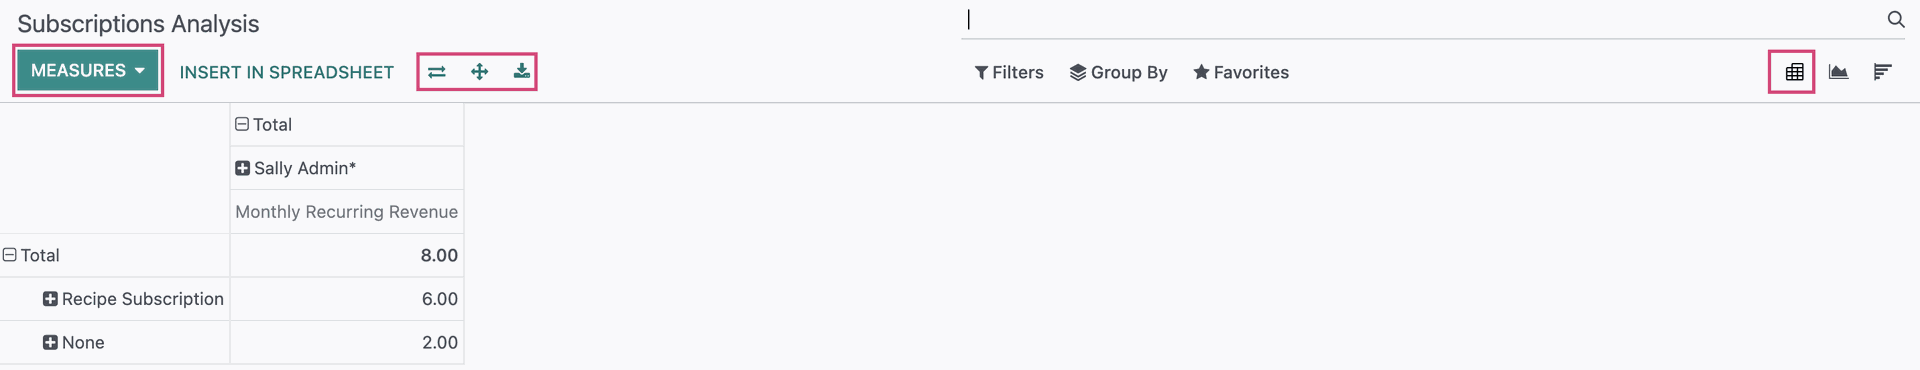
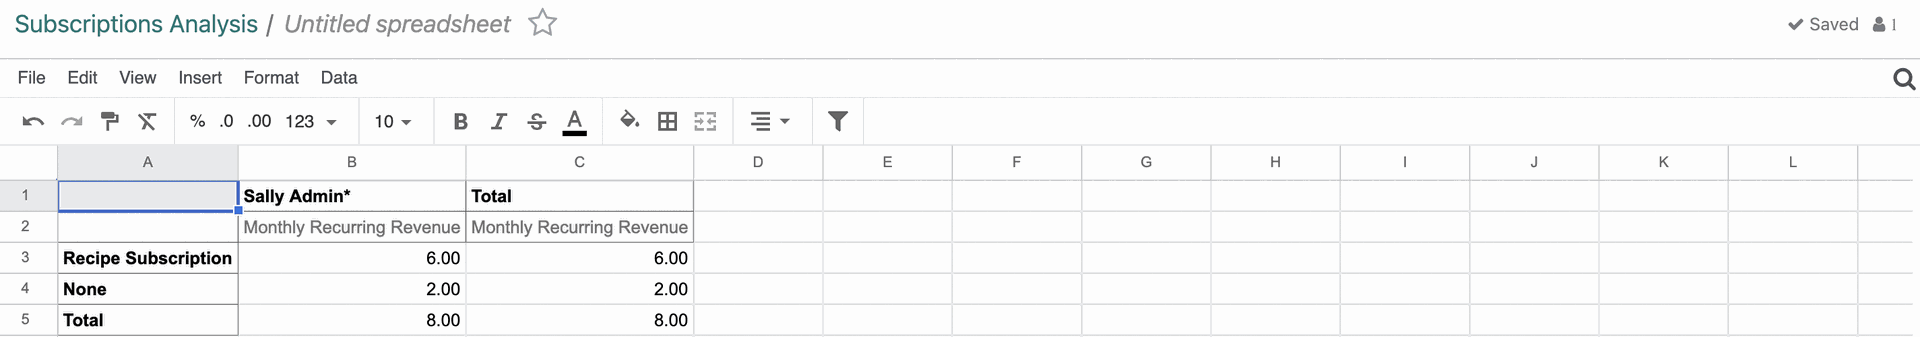
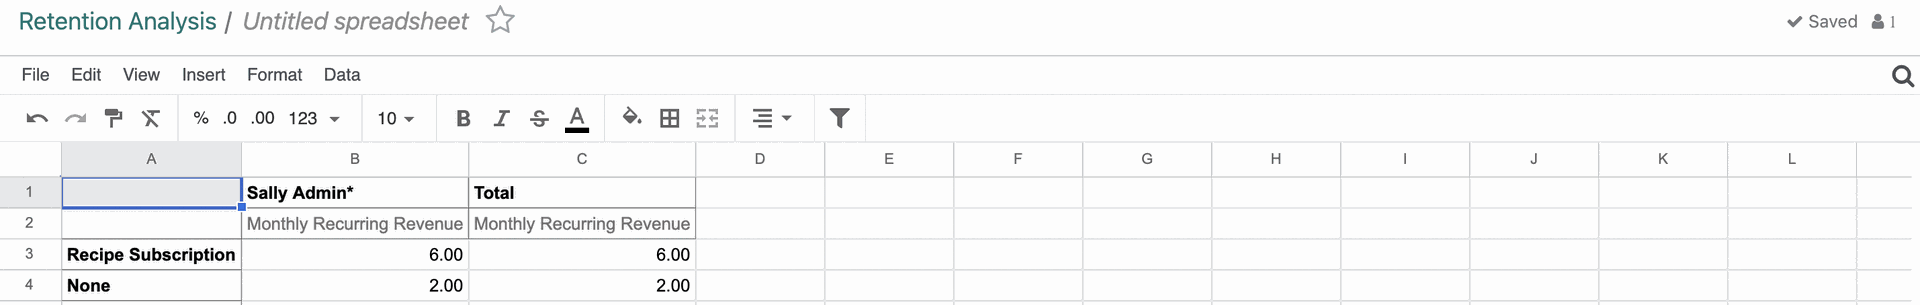
INSERT IN SPREADSHEET will allow you to create a spreadsheet that the information on the pivot view table can be viewed in.
Note: These are saved in the Documents app; please see the Spreadsheets documentation for more information.
Graph View
Like the pivot view, the graph view can be configured to show different data based on the MEASURES you determine. This view also has several different modifiers to view the information.
Bar Chart: This will display data in vertical bars, as shown in the image above.
Line Chart: This will display data as a line.
Pie Chart: This will display the data in a "pie" view with the different data fields being indicated by different colored "slices."
Stacked: This option is only visible if the Bar Chart view is being used. When viewing the bars as stacked, the data is presented in a single vertical bar, as opposed to multiple bars being shown for each data field.
Descending: This option is only visible if the Bar or Line view is in use, and displays the information in descending order.
Ascending: This option is only visible if the Bar or Line view is in use, and displays the information in ascending order.

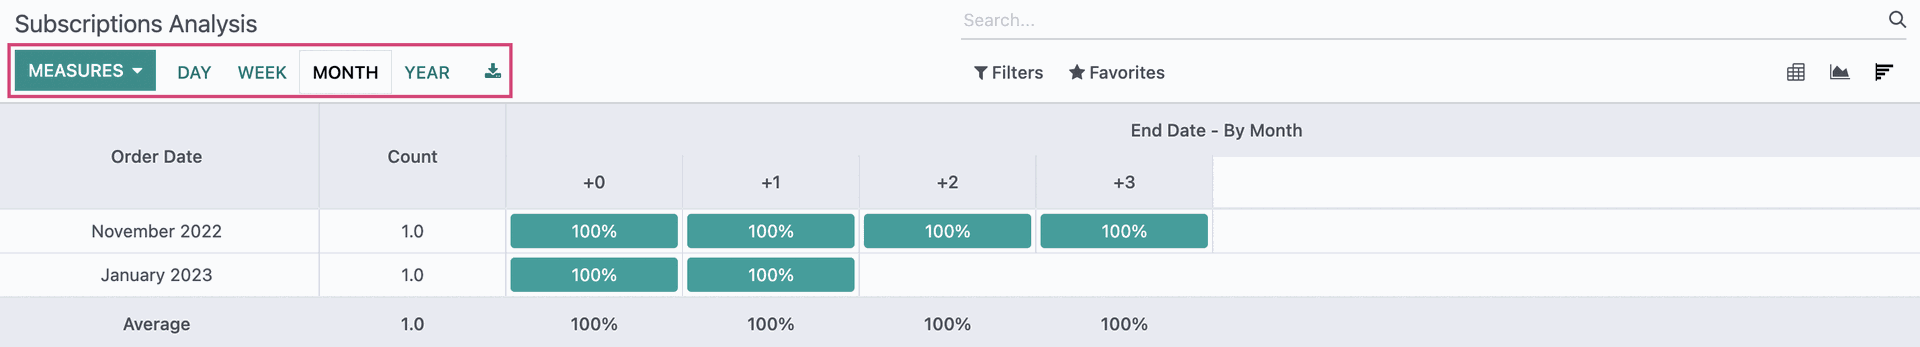
Cohort View
Similar to pivot view, selecting MEASURES in the cohort view will populate the table with data which can then be further specified by DAY, WEEK, MONTH, or YEAR .
Export in Excel File: This will create a downloaded .xlsx file on your computer.
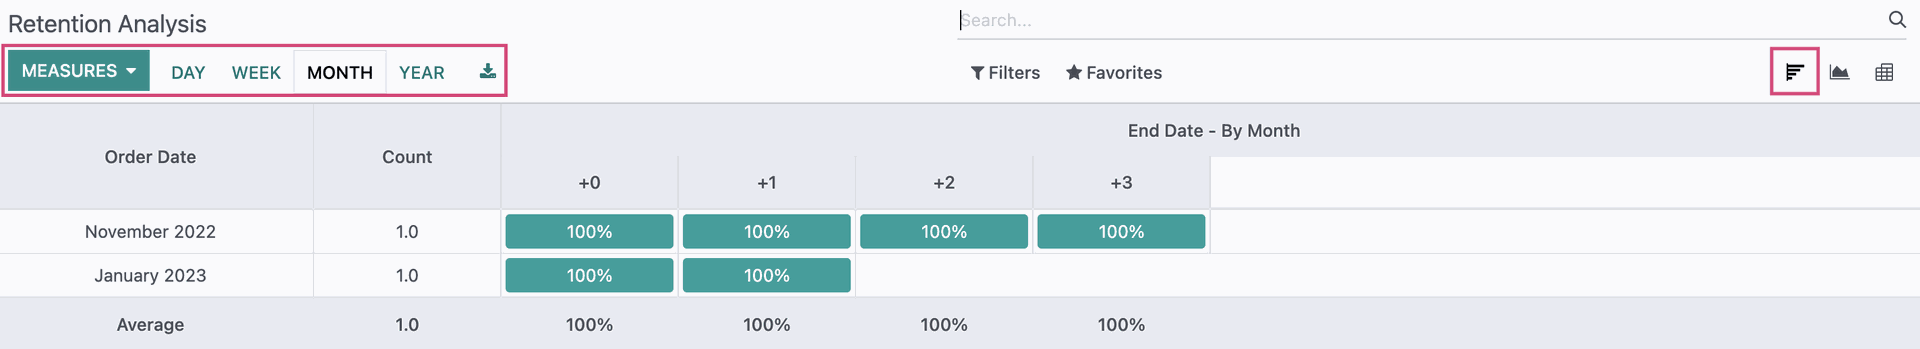
Subscription Retention
Clicking on REPORTING > RETENTION will show you data in cohort view and shows you the success rate of your subscriptions, specifically, how many of your subscribers have continued their subscriptions.
Cohort View
This report by default, will be in the Cohort view. Selecting Measures will populate the table with data which can then be further specified by Day, week, month, or year.
Export in Excel: This will let you create a downloadable .xlsx file on your computer.
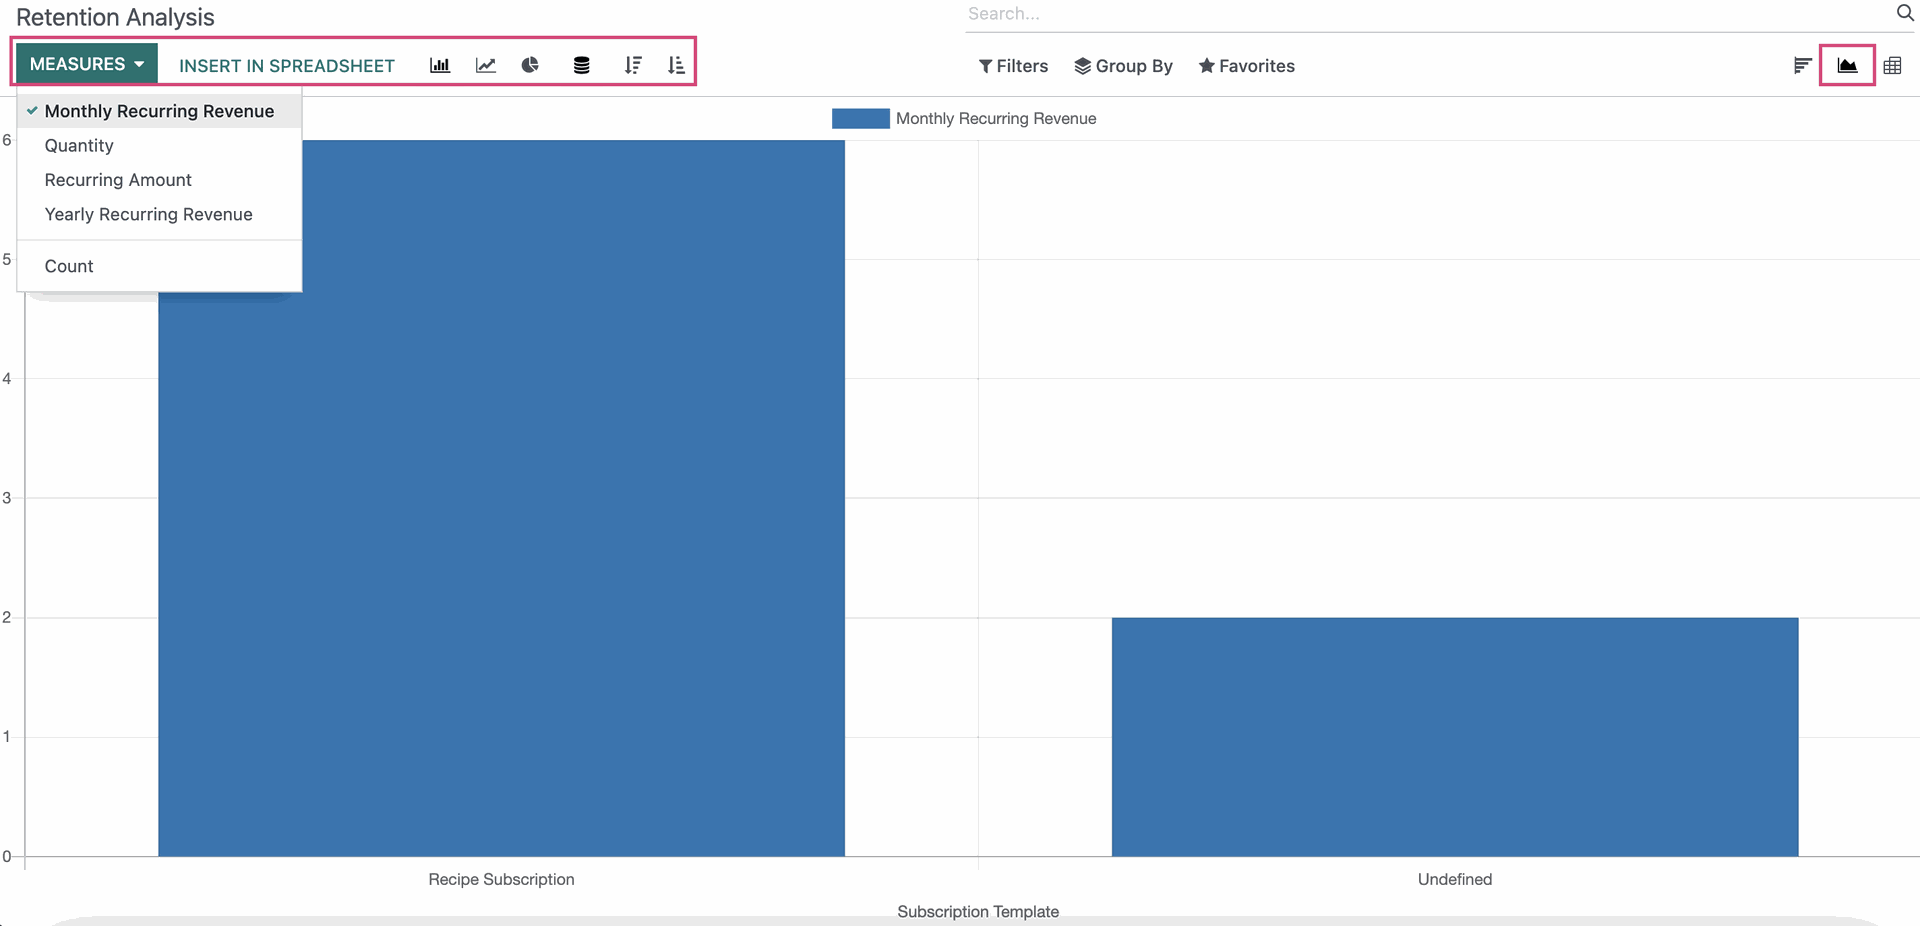
Graph View
This can be configured to show different data based on the MEASURES you determine. This view also has several different modifiers to view the information.
Bar Chart: This will display data in vertical bars, as shown in the image below.
Line Chart: This will display data as a line.
Pie Chart: This will display the data in a "pie" view with the different data fields being indicated by different colored "slices."
Stacked: This option is only visible if the Bar Chart view is being used. When viewing the bars as stacked, the data is presented in a single vertical bar, as opposed to multiple bars being shown for each data field.
Descending: This option is only visible if the Bar or Line view is in use, and displays the information in descending order.
Ascending: This option is only visible if the Bar or Line view is in use, and displays the information in ascending order.
Pivot View
On the left, we see the menu MEASURES that will let you populate the table with whichever information you wish to view.
You will have the following options:
Flip Axis: This will flip the data displayed on the X and Y axis.
Expand All: This will expand any field with an icon to reveal any nested information.
Download xlsx: This will allow you to download the displayed information into an .xlsx file.
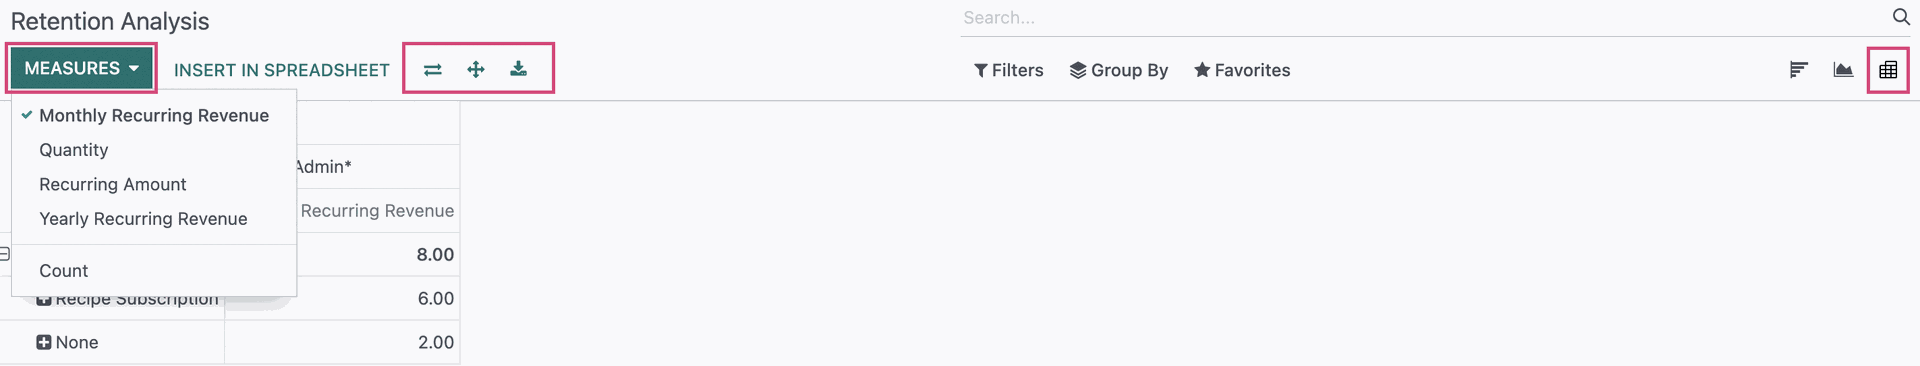
INSERT IN SPREADSHEET will allow you to create a spreadsheet that the information on the pivot view table can be viewed in.
Note: These are saved in the Documents app; please see the Spreadsheets documentation for more information.
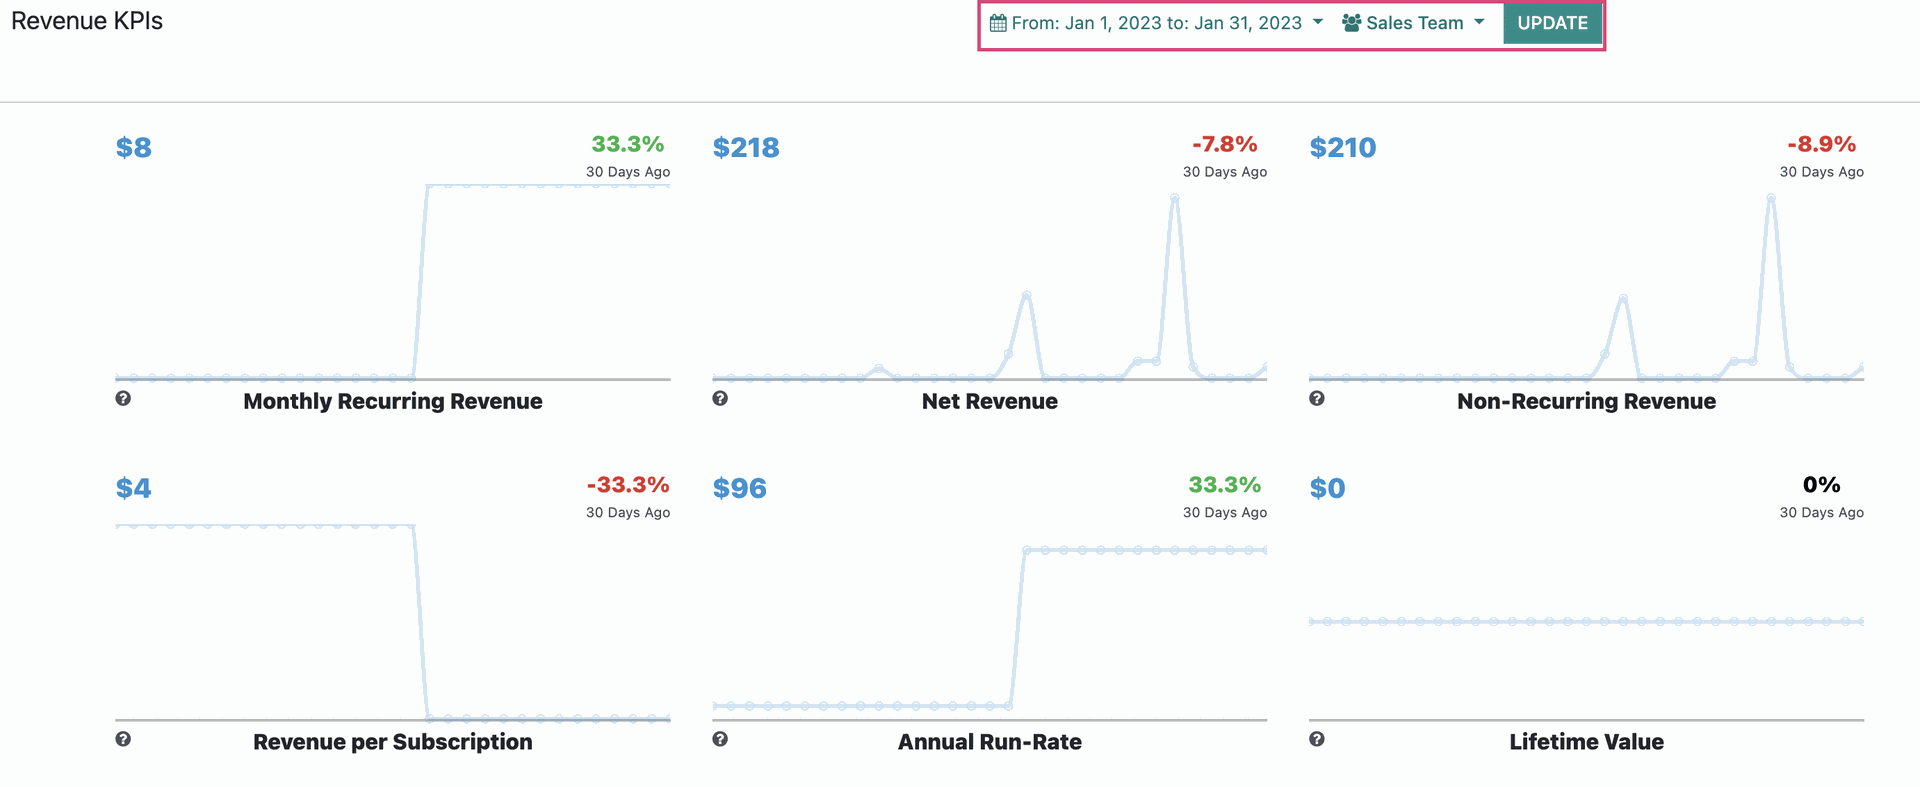
Revenue KPI's (Key Performance Indicators)
Click REPORTING > REVENUE KPIs will bring you to an overview with plenty of configurable variables. KPI's are used by a company to measure it's business objectives and success, and this report shows those metrics in relation to subscriptions.
Dates: Select a date range of data to display.
Subscriptions: Choose a subscription to view from a list of existing subscriptions. Leave unspecified to see all information.
Categories: Select a category to have displayed. Leave this unspecified to see all information.
Companies: Select the company of which you would like to view the revenue KPI information.
Sales Team: Specify a sales team to view targeted data, or leave unspecified to view all data.
Don't forget to click UPDATE in order for changes to take effect.
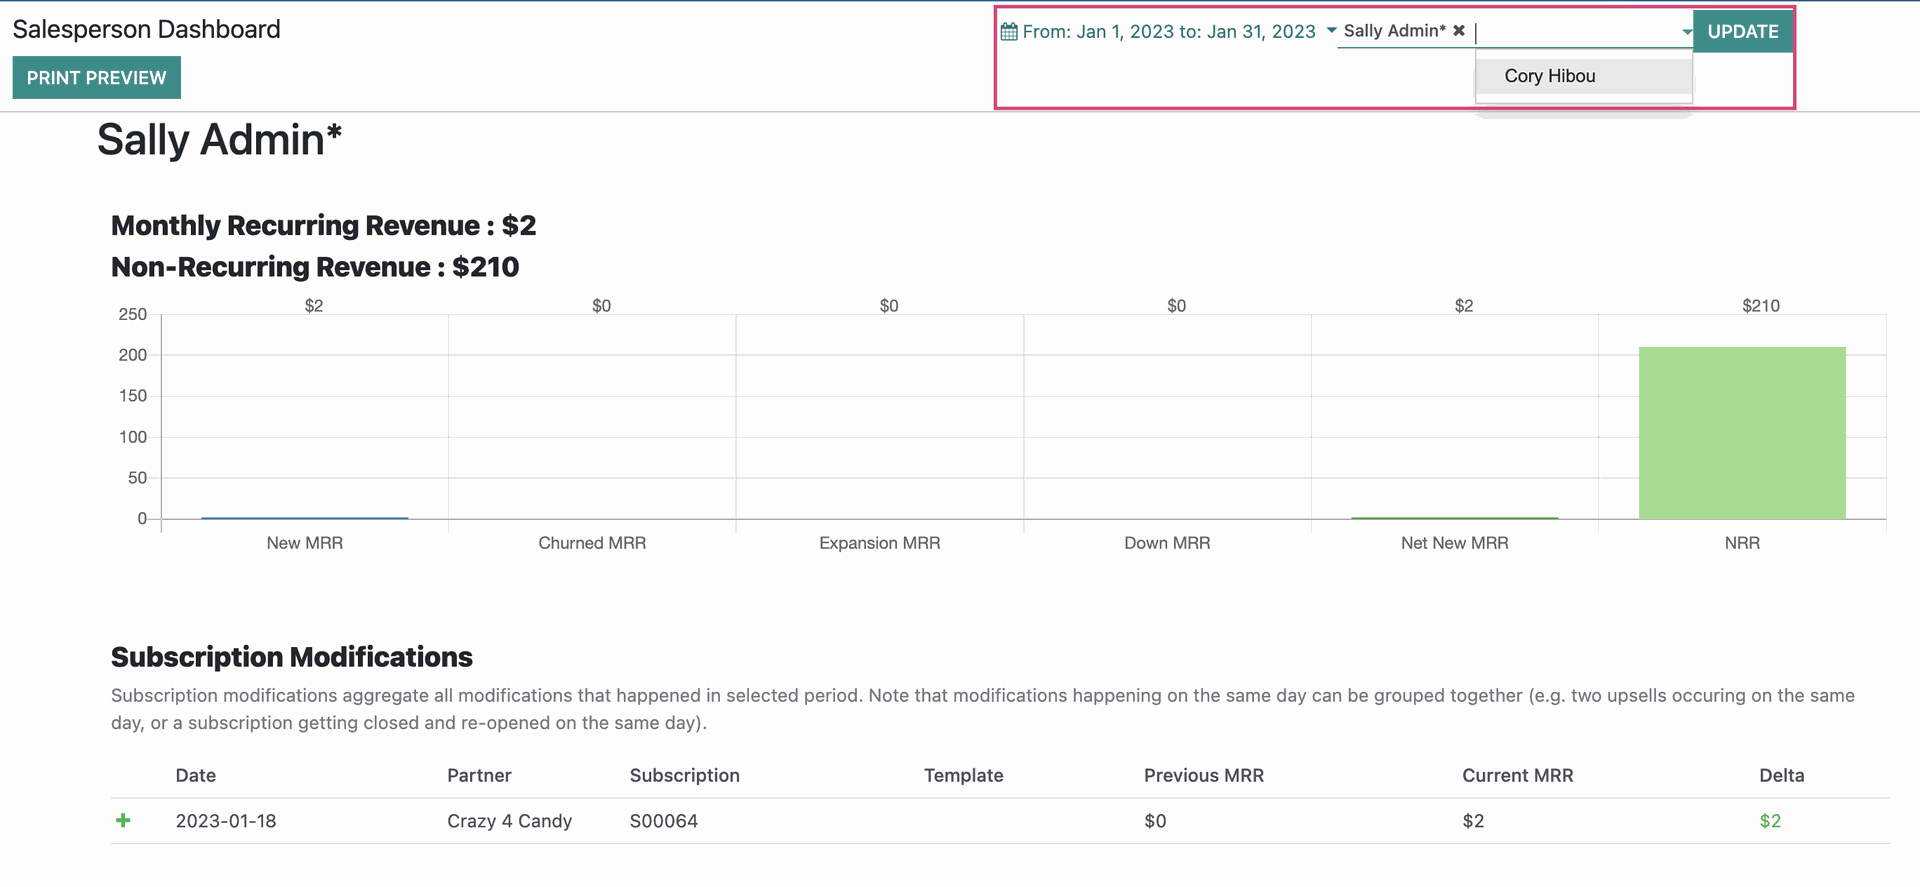
Salesperson Dashboard
The Salesperson Dashboard is a summary of an employee's MRR (monthly recurring revenue), NRR (non-recurring revenue), subscription modifications, and Non-Recurring invoices. This information can be edited in the top right corner by selecting specific dates and employees to display.
Clicking REPORTING > SALESPERSON DASHBOARD will bring you to the following screen:
Dates: Select a date range of data to display.
_____ User List: Add or remove users on the line next to your specified dates to view sales data of different users
Don't forget to click UPDATE for changes to take effect.
Clicking PRINT PREVIEW , located on the top left of the screen, will download a PDF of the information displayed to your computer.
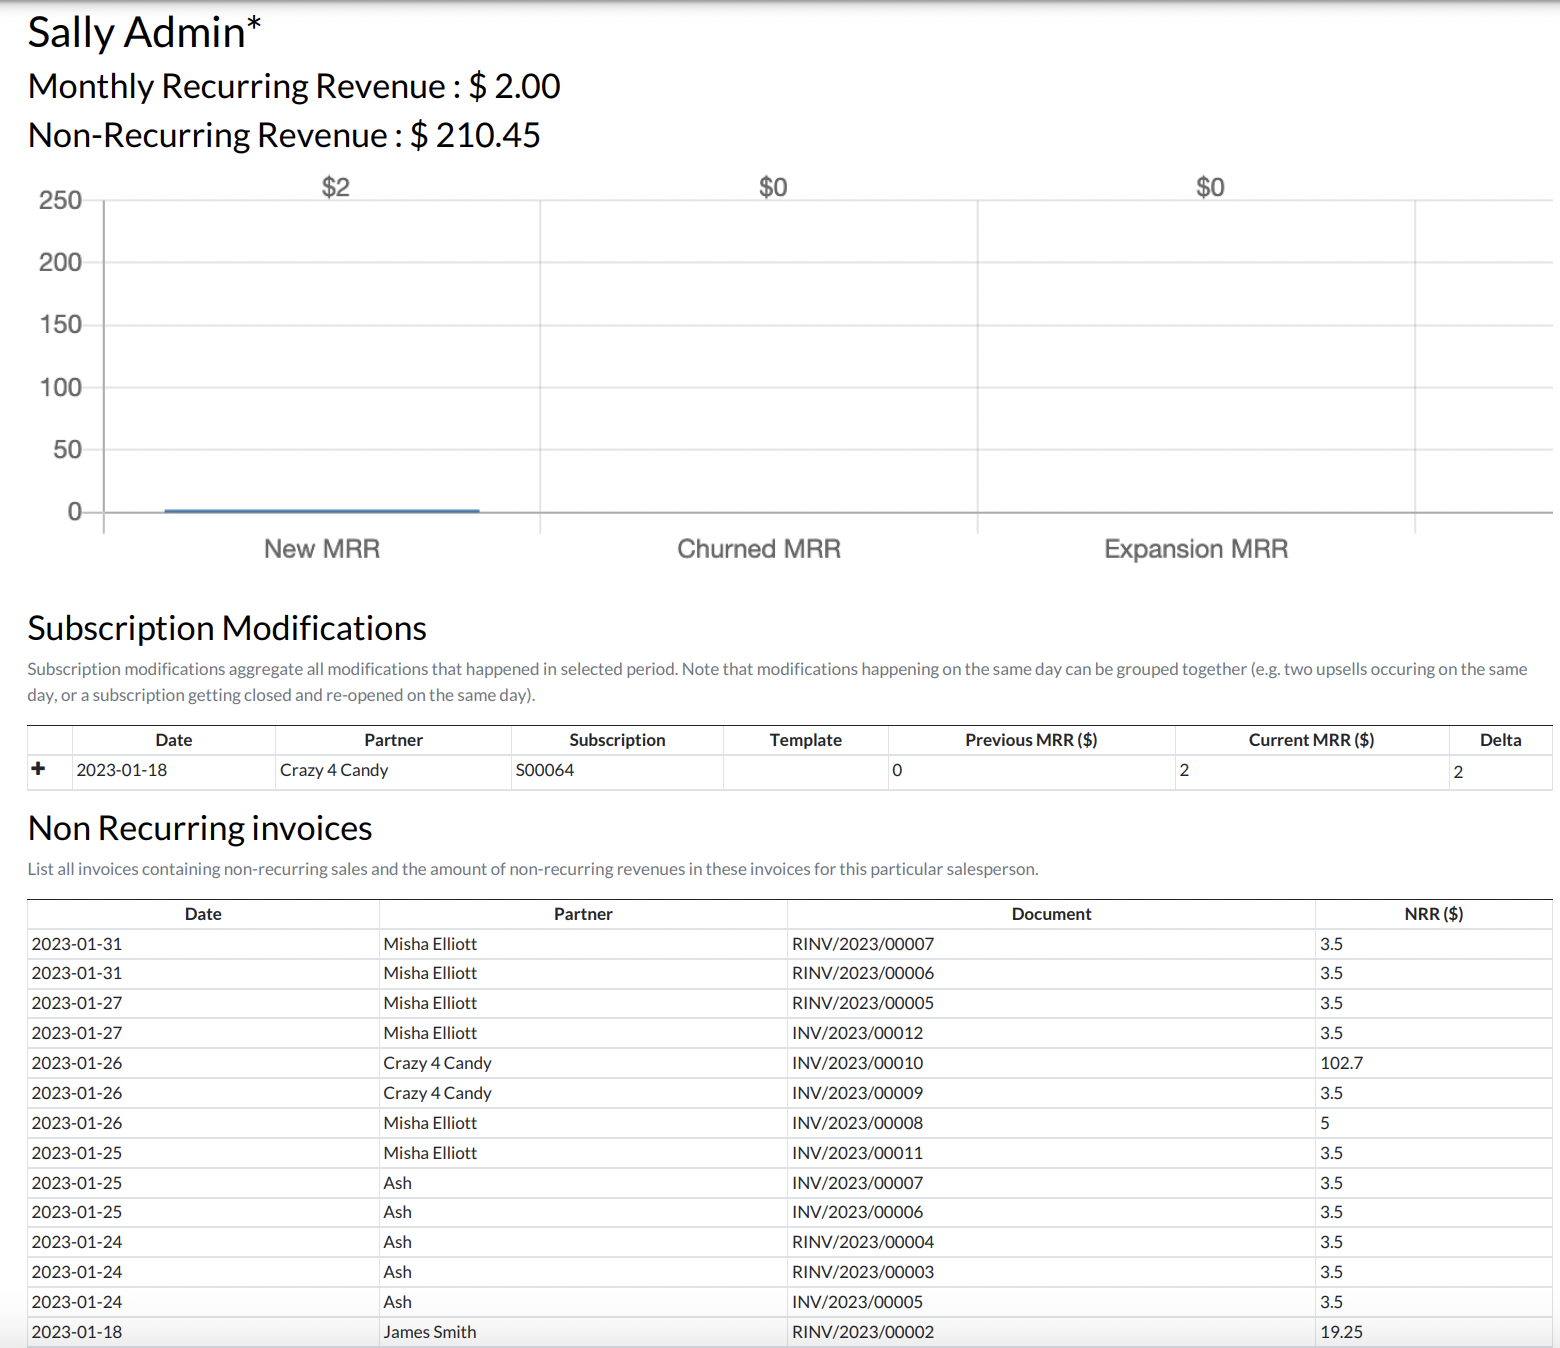
In addition, you can also click the to be taken to the subscription associated with the line data under Subscription Modifications.
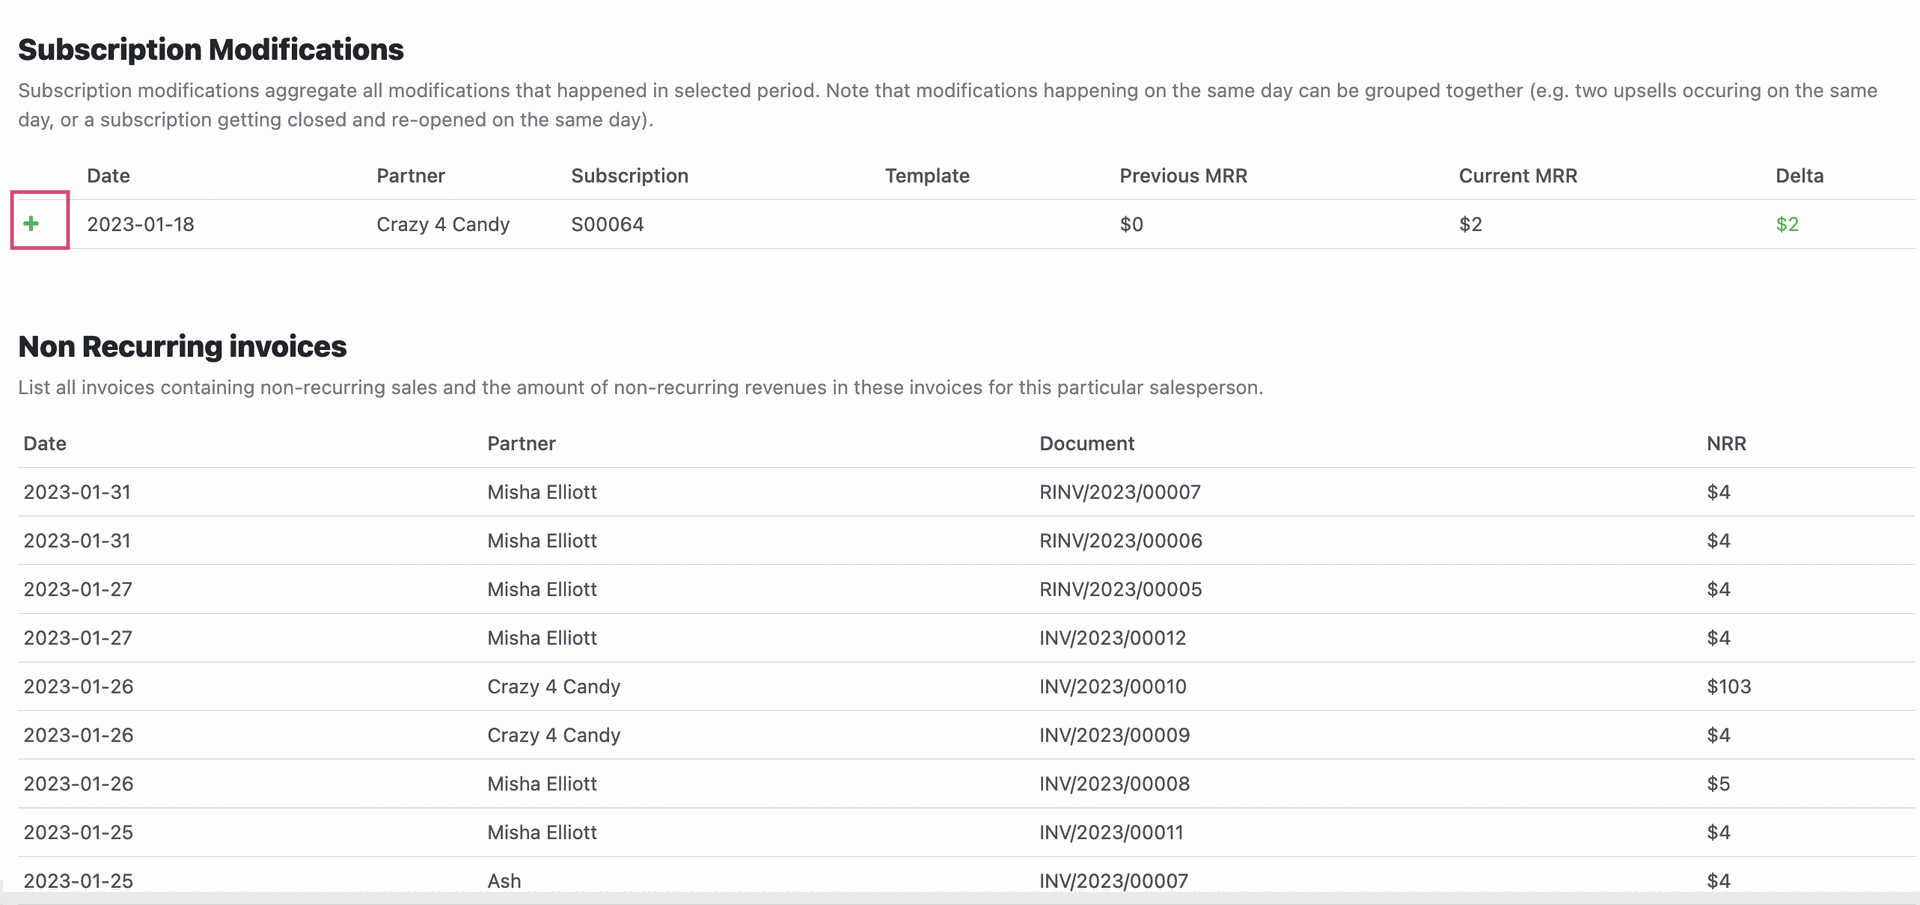
This will let you click RENEW or UPSELL.
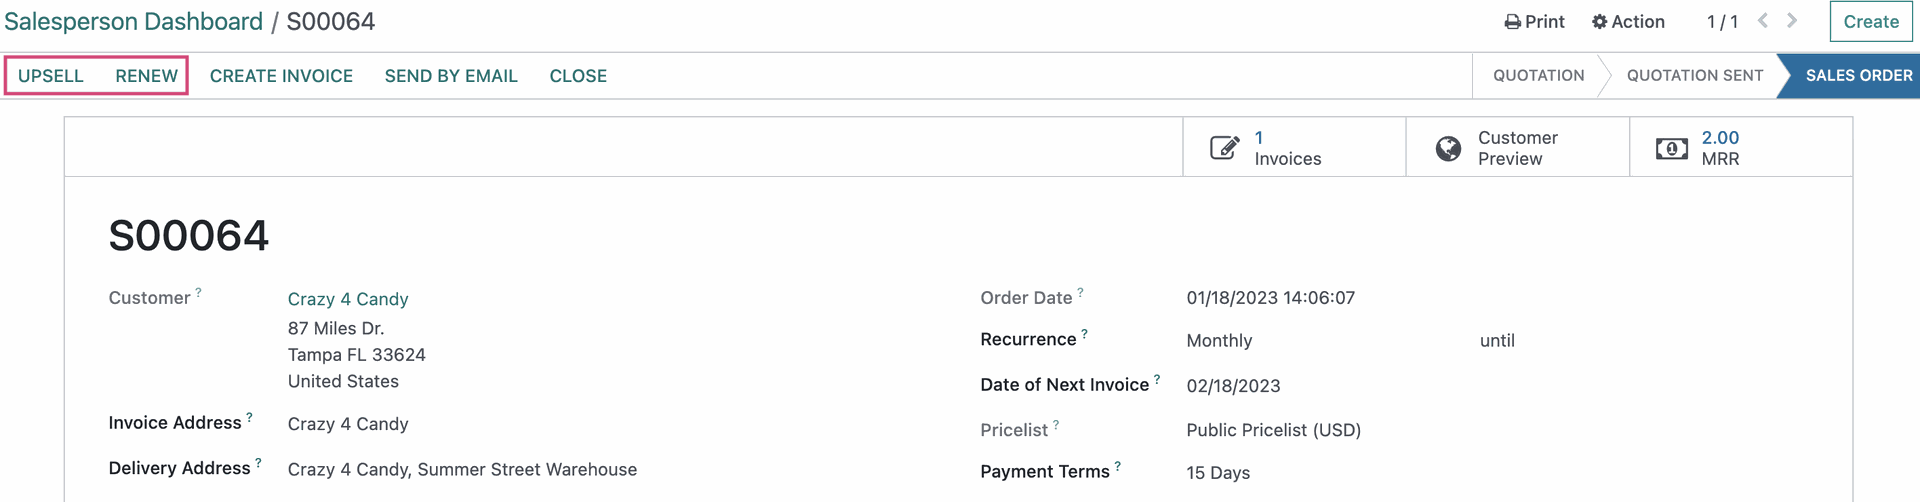
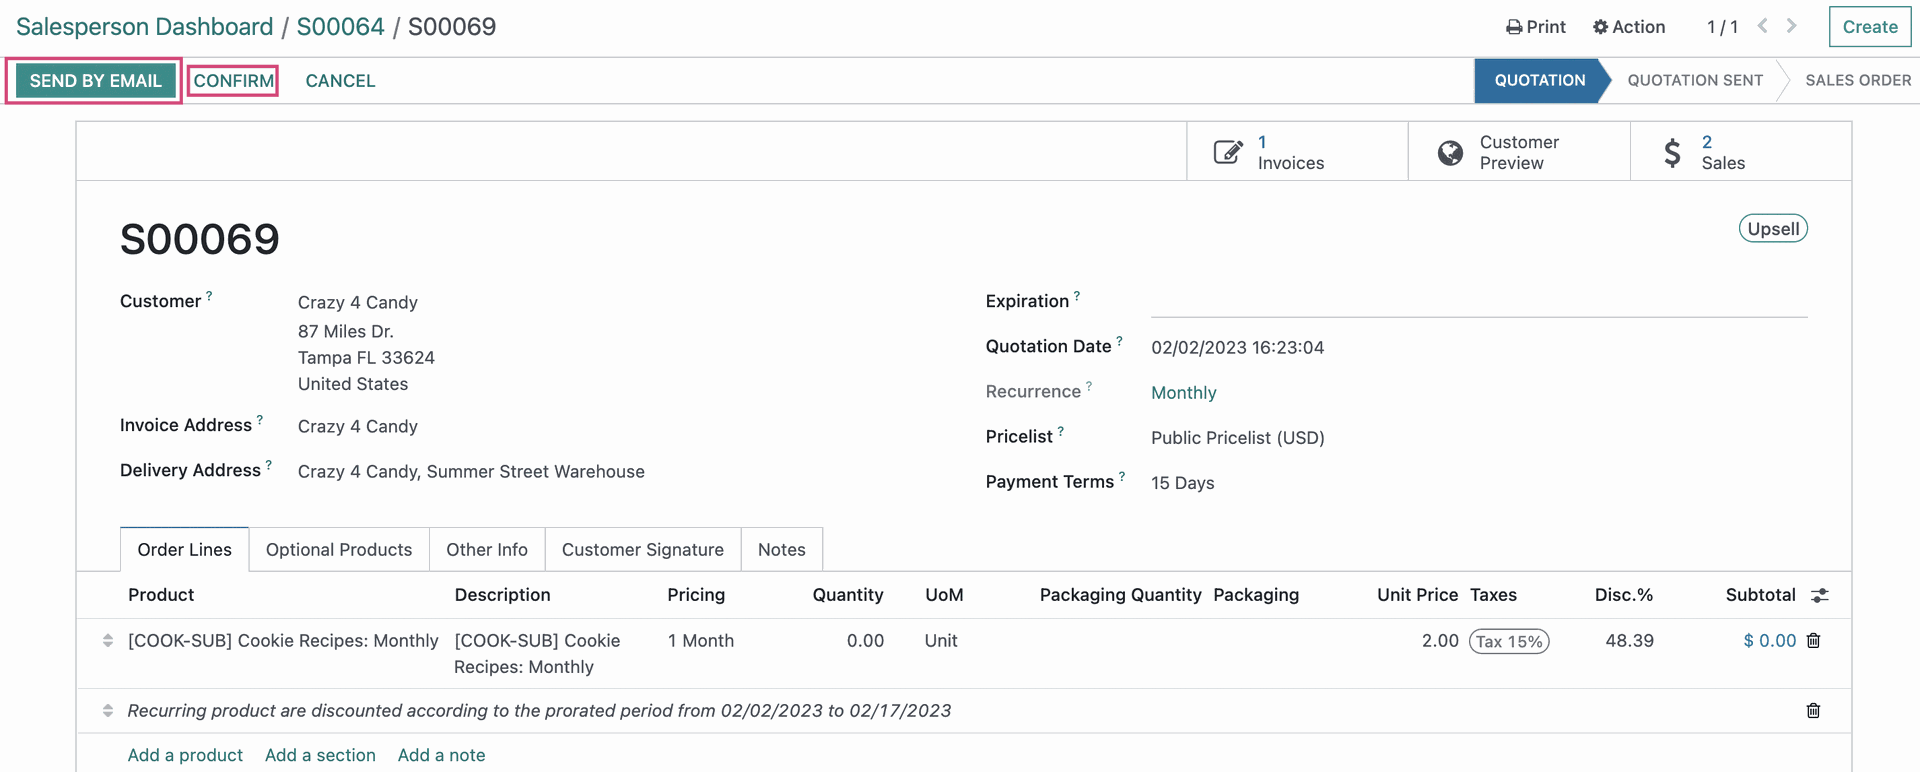
Quotation Renewal
Quotation renewal will populate a copy of the subscription into a new template so that all you have to do is verify the information and either SEND BY EMAIL or CONFIRM.